Aroon Indicator Explanation
The Aroon is a trend indicator that measures how long it has been since the highest high and lowest low occurred within a specified period. Developed by Tushar Chande in 1995 and introduced in his book "The New Technical Trader," Aroon consists of two lines: Aroon Up (measuring time since highest high) and Aroon Down (measuring time since lowest low). Both lines oscillate between 0 and 100, with values above 70 typically indicating strong trends and values below 30 indicating weak trends. The Aroon indicator helps identify trend strength, direction, and potential trend changes by measuring the time since recent extremes.
How Aroon Works: Aroon is calculated by measuring the number of periods since the highest high and lowest low occurred within a specified lookback period (typically 25 periods). Aroon Up = ((Period - Periods Since Highest High) / Period) × 100, and Aroon Down = ((Period - Periods Since Lowest Low) / Period) × 100. When Aroon Up is above 70 and Aroon Down is below 30, it indicates a strong uptrend. When Aroon Down is above 70 and Aroon Up is below 30, it indicates a strong downtrend. When both lines are below 50, it suggests a ranging or consolidating market. The Aroon Oscillator (Aroon Up - Aroon Down) provides a single line that oscillates between -100 and +100, with positive values indicating uptrends and negative values indicating downtrends.
When to Use Aroon:
- Trend Strength Identification: Aroon is highly effective at identifying trend strength and direction. Values above 70 on Aroon Up indicate strong upward momentum, while values above 70 on Aroon Down indicate strong downward momentum. This makes it valuable for confirming trend strength before entering trades.
- Trend Change Detection: When Aroon Up crosses above Aroon Down, it signals a potential uptrend beginning, and when Aroon Down crosses above Aroon Up, it signals a potential downtrend beginning. These crossovers provide early signals of trend changes.
- Ranging Market Identification: When both Aroon lines are below 50, it indicates a ranging or consolidating market, helping traders avoid trend-following strategies during these periods. This information is valuable for adjusting trading strategies based on market conditions.
Advantages:
- Provides clear signals for trend strength and direction through simple numerical values (0-100), making it easy to interpret and implement in automated trading systems. The indicator is objective and doesn't require subjective interpretation.
- Helps identify trend changes early through crossovers, allowing traders to enter trends at their beginning stages. The time-based measurement provides unique insights into trend dynamics.
- Works effectively across multiple timeframes and asset classes, including stocks, forex, commodities, and cryptocurrencies. The indicator adapts well to different market conditions.
Limitations:
- Aroon can produce false signals in ranging markets when both lines oscillate around 50, leading to frequent crossovers without clear directional movement. The indicator works best in clearly trending markets.
- The indicator may lag behind price movements during rapid trend changes, as it relies on historical highs and lows. This lag can result in delayed entry and exit signals.
- Aroon does not provide information about price magnitude or volatility, only the time since recent extremes. Traders should combine it with other indicators for more comprehensive analysis.
In summary, Aroon is a valuable trend indicator that measures trend strength and direction through time-based analysis, making it ideal for identifying strong trends and early trend changes. For comprehensive understanding, refer to Chande's original work "The New Technical Trader" (1995), Investopedia's Aroon guide, TradingView's Aroon documentation, and academic research on trend strength indicators in technical analysis published in journals such as the Journal of Financial Markets and the Review of Financial Studies.
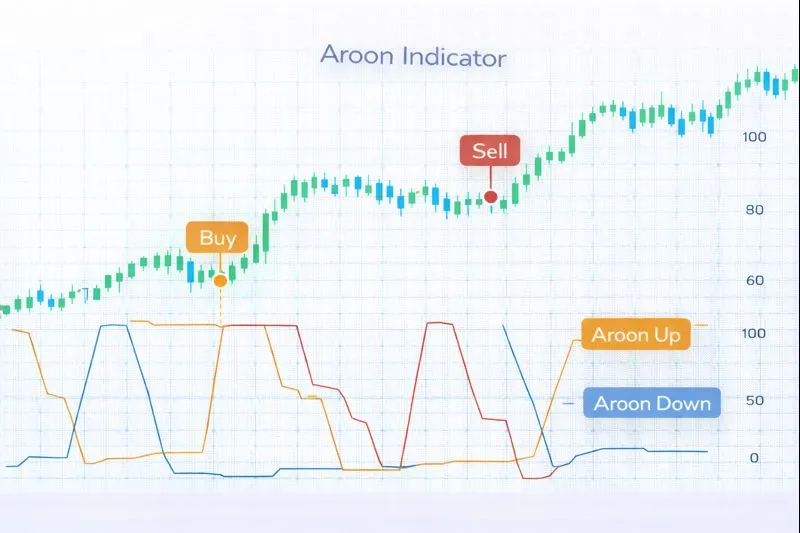
Practical Example: Using the Aroon Indicator in a Trading Strategy
The Aroon is a trend indicator used to identify trend strength, direction, and potential trend changes through time-based analysis. In a trading strategy, the Aroon indicator helps traders make entry and exit decisions based on trend strength and Aroon crossovers.
Scenario: You're creating a trend-following strategy for Gold (XAU/USD) on a 4-hour chart. You want to buy when Aroon Up crosses above Aroon Down and both are above 50 (indicating strong uptrend), and sell when Aroon Down crosses above Aroon Up and both are above 50 (indicating strong downtrend).
Strategy Logic:
- Calculate the Aroon(25) using a 25-period lookback. The Aroon provides trend strength and direction signals. Aroon Up above 70 indicates strong upward momentum, while Aroon Down above 70 indicates strong downward momentum. Crossovers signal trend changes.
- Buy signal: When Aroon Up crosses above Aroon Down and Aroon Up is above 50, indicating a strong uptrend beginning with upward momentum building.
- Sell signal: When Aroon Down crosses above Aroon Up and Aroon Down is above 50, indicating a strong downtrend beginning with downward momentum building.
Backtrader Example:
import backtrader as bt

class AroonTrendStrategy(bt.Strategy):
    params = dict(
        aroon_period=25
    )

    def __init__(self):
        # Calculate Aroon Up and Down
        periods_since_high = bt.ind.PeriodsSinceHighest(self.data.high, period=self.p.aroon_period)
        periods_since_low = bt.ind.PeriodsSinceLowest(self.data.low, period=self.p.aroon_period)

        self.aroon_up = ((self.p.aroon_period - periods_since_high) / self.p.aroon_period) * 100
        self.aroon_down = ((self.p.aroon_period - periods_since_low) / self.p.aroon_period) * 100

    def next(self):
        if not self.position:
            # Buy when Aroon Up crosses above Aroon Down and both are above 50
            if (self.aroon_up[0] > self.aroon_down[0] and
                self.aroon_up[-1] <= self.aroon_down[-1] and
                self.aroon_up[0] > 50):
                self.buy()
        else:
            # Sell when Aroon Down crosses above Aroon Up and both are above 50
            if (self.aroon_down[0] > self.aroon_up[0] and
                self.aroon_down[-1] <= self.aroon_up[-1] and
                self.aroon_down[0] > 50):
                self.sell()

# Usage
cerebro = bt.Cerebro()
cerebro.addstrategy(AroonTrendStrategy)
Expected Outcome: By using the Aroon indicator, your strategy identifies trend strength and direction through time-based analysis, helping you enter trades when trends are strong and exit when trends reverse. This approach leads to better trend-following performance, improved trend strength confirmation, and enhanced risk management by trading only during strong trends with clear directional bias.
💡 Bonus Tip
Consider using Aroon in combination with price action for confirmation. When Aroon Up is above 70 and price makes new highs, it suggests strong upward momentum with higher probability of trend continuation. This technique, documented in Chande's original methodology, can significantly improve the reliability of Aroon-based trading strategies.
Using the Aroon indicator ensures your strategy identifies strong trends and trend changes effectively, improving entry and exit timing based on time-based trend analysis.