Donchian Channel Indicator Explanation
The Donchian Channel is a trend-following indicator that creates price channels based on the highest high and lowest low over a specified period. Developed by Richard Donchian, a pioneer in managed futures trading, in the 1950s and popularized through his work on trend-following systems, Donchian Channels consist of three lines: an upper band (highest high), a lower band (lowest low), and a middle line (average of the two). The indicator is particularly effective for identifying breakouts and support/resistance levels, making it a cornerstone of many trend-following trading systems, including the famous "Turtle Trading" system.
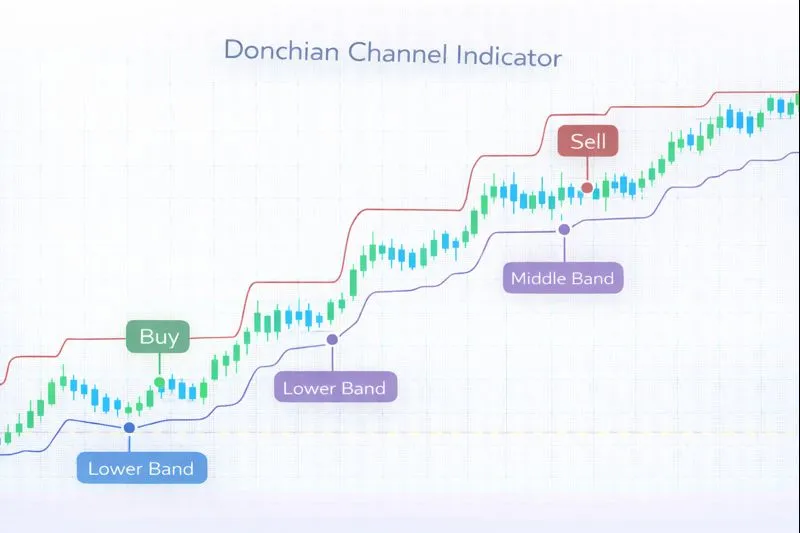
How Donchian Channel Works: Donchian Channels are calculated by identifying the highest high and lowest low over a specified lookback period (typically 20 periods). The upper band is the highest high over the period, the lower band is the lowest low over the period, and the middle band is the average of the two: Middle Band = (Upper Band + Lower Band) / 2. The channel width represents the price range over the lookback period, with wider channels indicating higher volatility and narrower channels indicating lower volatility. When price breaks above the upper band, it signals a potential uptrend breakout, and when price breaks below the lower band, it signals a potential downtrend breakout.
When to Use Donchian Channel:
- Breakout Identification: Donchian Channels are highly effective for identifying breakouts when price moves outside the channel boundaries. A breakout above the upper band signals potential uptrend continuation, while a breakout below the lower band signals potential downtrend continuation. This makes it valuable for trend-following strategies.
- Support and Resistance Levels: The upper and lower bands act as dynamic support and resistance levels. The upper band provides resistance in uptrends, while the lower band provides support in downtrends. Price bouncing off these levels can signal trend continuation or reversal.
- Volatility Assessment: The channel width indicates market volatility, with wider channels suggesting higher volatility and narrower channels suggesting lower volatility. This information can be used to adjust position sizing and risk management.
Advantages:
- Provides clear, objective breakout signals without requiring interpretation, making it easy to implement in automated trading systems. The simple calculation method ensures reliability across all trading platforms.
- Works effectively in trending markets across multiple asset classes, including stocks, forex, commodities, and cryptocurrencies. The indicator is particularly useful for medium to long-term trend following.
- Helps identify support and resistance levels dynamically, adapting to changing market conditions. The channel boundaries provide clear reference points for entry and exit decisions.
Limitations:
- Donchian Channels can produce false breakout signals in ranging or sideways markets when price oscillates around the channel boundaries, leading to whipsaws and multiple small losses. The indicator works best in clearly trending markets.
- The indicator may lag behind price movements during rapid trend changes, as it relies on historical highs and lows. This lag can result in delayed entry and exit signals, potentially missing significant portions of profitable moves.
- Donchian Channels do not provide information about trend strength or momentum, only price position relative to recent range. Traders should combine it with momentum indicators for more comprehensive analysis.
In summary, Donchian Channels are valuable trend-following indicators that provide clear breakout signals and dynamic support/resistance levels, making them ideal for traders seeking simplicity and effectiveness in trending markets. For comprehensive understanding, refer to Donchian's original work on trend-following systems, Investopedia's Donchian Channel guide, TradingView's Donchian Channel documentation, and academic research on breakout trading systems published in journals such as the Journal of Financial Markets and the Review of Financial Studies.
Practical Example: Using the Donchian Channel Indicator in a Trading Strategy
The Donchian Channel is a trend-following indicator used to identify breakouts and dynamic support/resistance levels. In a trading strategy, the Donchian Channel indicator helps traders make entry and exit decisions based on price breakouts and channel interactions.
Scenario: You're creating a breakout strategy for EUR/USD on a 4-hour chart. You want to buy when price breaks above the upper Donchian Channel (indicating uptrend breakout) and sell when price breaks below the lower Donchian Channel (indicating downtrend breakout), using the channel boundaries as stop-loss levels.
Strategy Logic:
- Calculate the Donchian Channel(20) using a 20-period lookback. The upper band represents the highest high over 20 periods, the lower band represents the lowest low over 20 periods, and the middle band is the average of the two. The channel provides clear breakout signals and dynamic support/resistance levels.
- Buy signal: When price closes above the upper Donchian Channel, indicating a potential uptrend breakout. The lower band acts as a stop-loss level.
- Sell signal: When price closes below the lower Donchian Channel, indicating a potential downtrend breakout. The upper band acts as a stop-loss level.
Backtrader Example:
import backtrader as bt

class DonchianChannelStrategy(bt.Strategy):
    params = dict(
        donchian_period=20
    )

    def __init__(self):
        self.donchian = bt.ind.Donchian(period=self.p.donchian_period)

    def next(self):
        if not self.position:
            # Buy when price breaks above upper band
            if self.data.close[0] > self.donchian.lines.top[0]:
                self.buy()
        else:
            # Sell when price breaks below lower band or use lower band as stop-loss
            if self.data.close[0] < self.donchian.lines.bot[0]:
                self.sell()

# Usage
cerebro = bt.Cerebro()
cerebro.addstrategy(DonchianChannelStrategy)
Expected Outcome: By using the Donchian Channel indicator, your strategy identifies breakouts and follows trends with clear entry and exit signals, while the channel boundaries provide dynamic stop-loss levels. This approach leads to better breakout identification, improved trend-following performance, and enhanced risk management by using channel boundaries as stop-losses.
💡 Bonus Tip
Consider using Donchian Channels in combination with volume confirmation. When price breaks above the upper band with increasing volume, it suggests strong buying interest and higher probability of trend continuation. This technique, documented in the Turtle Trading system methodology, can significantly improve the reliability of Donchian Channel-based trading strategies.
Using the Donchian Channel indicator ensures your strategy identifies breakouts effectively and follows trends with clear entry and exit signals, improving trading performance based on dynamic channel analysis.