Envelopes Indicator Explanation
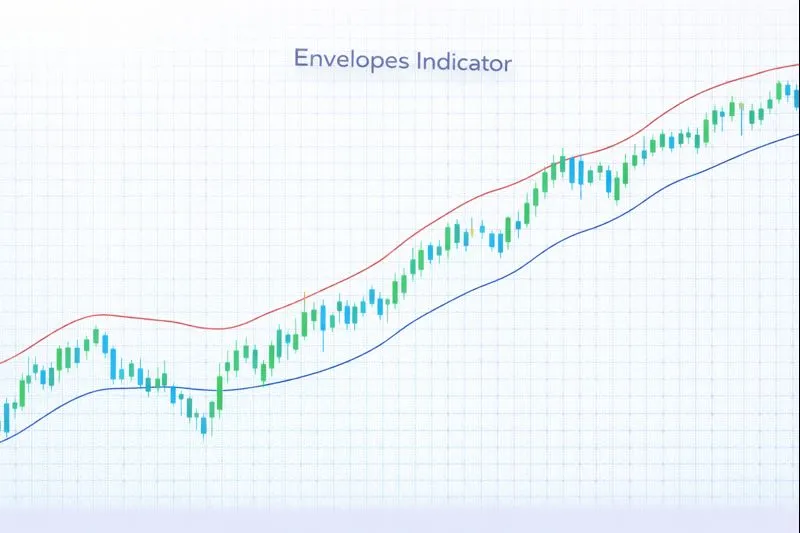
The Envelopes are trend indicators that create parallel bands around a moving average by adding and subtracting a fixed percentage from the moving average value. Developed as a variation of Bollinger Bands using percentage-based bands instead of standard deviation, Envelopes consist of three lines: an upper band (moving average + percentage), a middle line (moving average), and a lower band (moving average - percentage). The envelopes expand and contract with the moving average, providing dynamic support and resistance levels that adapt to trend direction. These indicators are particularly effective for identifying overbought and oversold conditions and mean-reversion opportunities in trending markets.
How Envelopes Work: Envelopes are calculated using a moving average (typically SMA or EMA) and a fixed percentage (typically 2.5% to 5%). The formula is: Upper Band = Moving Average × (1 + Percentage / 100), Middle Band = Moving Average, and Lower Band = Moving Average × (1 - Percentage / 100). The percentage determines the width of the envelope: larger percentages create wider bands, while smaller percentages create narrower bands. When price touches or exceeds the upper band, it suggests overbought conditions, and when price touches or goes below the lower band, it suggests oversold conditions. The moving average acts as the trend line, with price above it indicating an uptrend and price below it indicating a downtrend.
When to Use Envelopes:
- Mean Reversion Trading: Envelopes are highly effective for mean-reversion strategies in trending markets, where traders buy when price touches the lower band (oversold) and sell when price touches the upper band (overbought), assuming price will revert to the moving average. This approach works well when combined with trend confirmation.
- Trend Following with Dynamic Support/Resistance: The upper and lower bands act as dynamic support and resistance levels. In uptrends, the lower band provides support, while in downtrends, the upper band provides resistance. Price bouncing off these levels can signal trend continuation.
- Overbought/Oversold Identification: When price reaches or exceeds the envelope boundaries, it signals potential overbought or oversold conditions. However, in strong trends, price can remain near the envelope boundaries for extended periods, requiring trend confirmation.
Advantages:
- Provides simple, objective support and resistance levels based on moving averages and fixed percentages, making them easy to understand and implement. The fixed percentage ensures consistent band width relative to price.
- Works effectively in trending markets across multiple timeframes and asset classes, including stocks, forex, commodities, and cryptocurrencies. The envelopes adapt to trend direction through the moving average.
- Helps identify mean-reversion opportunities when price deviates significantly from the moving average, providing clear entry and exit signals for range-bound trading strategies.
Limitations:
- Envelopes use a fixed percentage, which means they don't adapt to changing market volatility like Bollinger Bands (which use standard deviation). In highly volatile markets, the fixed percentage may be too narrow, while in calm markets, it may be too wide.
- The indicator may produce false signals in strong trends when price remains near envelope boundaries for extended periods without reverting to the mean. Traders should combine envelopes with trend confirmation.
- Envelopes do not provide information about trend strength or momentum, only price position relative to percentage-based bands. Traders should combine them with momentum indicators for more comprehensive analysis.
In summary, Envelopes are valuable trend indicators that provide dynamic support and resistance levels through percentage-based bands, making them ideal for mean-reversion strategies and dynamic support/resistance identification in trending markets. For comprehensive understanding, refer to technical analysis literature on envelope indicators, Investopedia's Envelopes guide, TradingView's Envelopes documentation, and academic research on moving average envelopes in technical analysis published in journals such as the Journal of Financial Markets and the Review of Financial Studies.
Practical Example: Using the Envelopes Indicator in a Trading Strategy
The Envelopes are trend indicators used to identify dynamic support and resistance levels and mean-reversion opportunities. In a trading strategy, the Envelopes indicator helps traders make entry and exit decisions based on price interactions with percentage-based bands around a moving average.
Scenario: You're creating a mean-reversion strategy for EUR/USD on a 1-hour chart. You want to buy when price touches the lower envelope band (oversold) in an uptrend, and sell when price touches the upper envelope band (overbought), assuming price will revert to the moving average.
Strategy Logic:
- Calculate the Envelopes(20, 2.5%) using a 20-period SMA and 2.5% percentage. The envelopes provide dynamic support and resistance levels: upper band (SMA + 2.5%), middle band (SMA), and lower band (SMA - 2.5%). Price touching these bands signals potential reversals.
- Buy signal: When price touches the lower envelope band and the moving average is rising (indicating uptrend), suggesting oversold condition and potential upward reversal.
- Sell signal: When price touches the upper envelope band and the moving average is falling (indicating downtrend), suggesting overbought condition and potential downward reversal.
Backtrader Example:
import backtrader as bt

class EnvelopesMeanReversionStrategy(bt.Strategy):
    params = dict(
        ma_period=20,
        envelope_percentage=2.5
    )

    def __init__(self):
        self.ma = bt.ind.SMA(period=self.p.ma_period)
        self.upper_band = self.ma * (1 + self.p.envelope_percentage / 100)
        self.lower_band = self.ma * (1 - self.p.envelope_percentage / 100)

    def next(self):
        if not self.position:
            # Buy when price touches lower band and MA is rising (uptrend)
            if (self.data.close[0] <= self.lower_band[0] and
                self.ma[0] > self.ma[-1]):
                self.buy()
        else:
            # Sell when price reaches upper band or returns to MA
            if (self.data.close[0] >= self.upper_band[0] or
                abs(self.data.close[0] - self.ma[0]) < abs(self.data.close[-1] - self.ma[-1])):
                self.sell()

# Usage
cerebro = bt.Cerebro()
cerebro.addstrategy(EnvelopesMeanReversionStrategy)
Expected Outcome: By using the Envelopes indicator, your strategy identifies mean-reversion opportunities when price deviates from the moving average, helping you enter trades when price is oversold or overbought relative to the trend. This approach leads to better mean-reversion entries, improved risk-reward ratios, and enhanced consistency in ranging markets where price oscillates around the moving average.
💡 Bonus Tip
Consider using Envelopes in combination with trend confirmation. When price touches the lower envelope in an uptrend (MA rising), it suggests a stronger mean-reversion opportunity than in a downtrend. This technique, documented in technical analysis literature, can significantly improve the reliability of Envelopes-based trading strategies by trading in the direction of the prevailing trend.
Using the Envelopes indicator ensures your strategy identifies dynamic support and resistance levels effectively, improving entry and exit timing based on percentage-based envelope analysis.