Keltner Channels Indicator Explanation
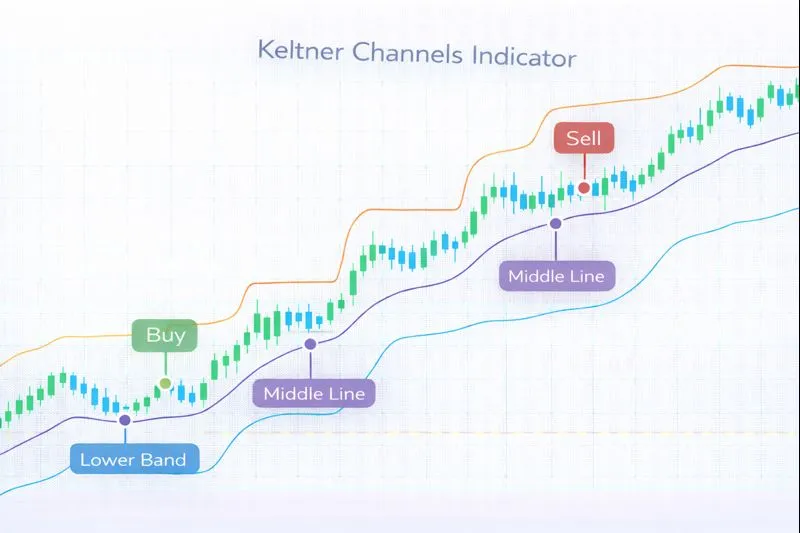
The Keltner Channels are volatility-based trend indicators that create price channels using an exponential moving average (EMA) and the Average True Range (ATR). Developed by Chester W. Keltner in the 1960s and later refined by Linda Bradford Raschke in the 1980s, Keltner Channels consist of three lines: an upper band (EMA + ATR multiplier), a middle line (EMA), and a lower band (EMA - ATR multiplier). The channels expand and contract with volatility, similar to Bollinger Bands but using ATR instead of standard deviation, making them smoother and less prone to sudden expansions. Keltner Channels are particularly effective for identifying trend direction, breakouts, and mean-reversion opportunities.
How Keltner Channels Work: Keltner Channels are calculated using an EMA (typically 20 periods) as the middle line and ATR (typically 10 periods) multiplied by a factor (typically 2.0) to create the upper and lower bands. The formula is: Upper Band = EMA + (Multiplier × ATR), Middle Band = EMA, and Lower Band = EMA - (Multiplier × ATR). The channels adapt to volatility through ATR, expanding during volatile periods and contracting during calm periods. When price is above the upper band, it suggests overbought conditions, and when price is below the lower band, it suggests oversold conditions. The middle EMA line acts as a trend indicator, with price above it indicating an uptrend and price below it indicating a downtrend.
When to Use Keltner Channels:
- Trend Following with Volatility Adjustment: Keltner Channels are highly effective for trend-following strategies as they provide clear trend direction through the middle EMA line and adapt to volatility through ATR. Price staying above the middle line with occasional touches of the upper band indicates a strong uptrend.
- Breakout Identification: When price breaks above the upper band with increasing volume, it signals a potential uptrend breakout. Conversely, when price breaks below the lower band, it signals a potential downtrend breakout. The volatility-adjusted bands help filter false breakouts.
- Mean Reversion Trading: In ranging markets, price touching or exceeding the upper or lower bands can signal mean-reversion opportunities. Traders can buy when price touches the lower band and sell when price touches the upper band, assuming price will revert to the middle line.
Advantages:
- Provides smoother channels than Bollinger Bands due to ATR-based calculation, reducing false signals during volatile periods. The EMA middle line provides clear trend direction.
- Adapts to market volatility through ATR, ensuring that channels are appropriate for current market conditions. This reduces the risk of premature signals in volatile markets.
- Works effectively across multiple timeframes and asset classes, including stocks, forex, commodities, and cryptocurrencies. The indicator is particularly useful for medium to long-term trend following and mean-reversion strategies.
Limitations:
- Keltner Channels can produce false signals in ranging markets when price oscillates around the middle line without clear directional movement, leading to whipsaws. The indicator works best in clearly trending or ranging markets.
- The indicator may lag behind price movements during rapid trend changes, as it relies on EMA and ATR calculations. This lag can result in delayed entry and exit signals.
- Keltner Channels do not provide information about trend strength or momentum on their own, only price position relative to volatility-adjusted channels. Traders should combine them with momentum indicators for more comprehensive analysis.
In summary, Keltner Channels are valuable trend indicators that provide volatility-adjusted price channels for trend following and mean-reversion strategies. For comprehensive understanding, refer to Keltner's original work and Raschke's refinements, Investopedia's Keltner Channels guide, TradingView's Keltner Channels documentation, and academic research on volatility-based channels in technical analysis published in journals such as the Journal of Financial Markets and the Review of Financial Studies.
Practical Example: Using the Keltner Channels Indicator in a Trading Strategy
The Keltner Channels are volatility-based trend indicators used to identify trend direction and provide dynamic support/resistance levels. In a trading strategy, the Keltner Channels indicator helps traders make entry and exit decisions based on trend direction and price interactions with the volatility-adjusted channels.
Scenario: You're creating a trend-following strategy for Bitcoin (BTC/USDT) on a 1-hour chart. You want to buy when price is above the middle EMA line (indicating uptrend) and price bounces off the lower band, and sell when price breaks below the middle line (indicating potential trend reversal).
Strategy Logic:
- Calculate the Keltner Channels(20, 10, 2.0) using a 20-period EMA, 10-period ATR, and 2.0 multiplier. The middle EMA line indicates trend direction, while the upper and lower bands provide dynamic support/resistance levels that adapt to volatility.
- Buy signal: When price is above the middle EMA line and bounces off the lower Keltner Channel band, indicating the uptrend is continuing and the lower band is acting as dynamic support.
- Sell signal: When price breaks below the middle EMA line after being above it, indicating potential trend reversal and exit opportunity.
Backtrader Example:
import backtrader as bt

class KeltnerChannelsStrategy(bt.Strategy):
    params = dict(
        ema_period=20,
        atr_period=10,
        multiplier=2.0
    )

    def __init__(self):
        self.ema = bt.ind.EMA(period=self.p.ema_period)
        self.atr = bt.ind.ATR(period=self.p.atr_period)
        self.upper_band = self.ema + (self.p.multiplier * self.atr)
        self.lower_band = self.ema - (self.p.multiplier * self.atr)

    def next(self):
        if not self.position:
            # Buy when price is above EMA and bounces off lower band
            if (self.data.close[0] > self.ema[0] and
                self.data.close[-1] <= self.lower_band[-1] and
                self.data.close[0] > self.lower_band[0]):
                self.buy()
        else:
            # Sell when price breaks below EMA
            if self.data.close[0] < self.ema[0]:
                self.sell()

# Usage
cerebro = bt.Cerebro()
cerebro.addstrategy(KeltnerChannelsStrategy)
Expected Outcome: By using the Keltner Channels indicator, your strategy identifies trend direction with volatility-adjusted support and resistance levels, helping you enter trades when trends are strong and exit when trends weaken. This approach leads to better trend-following performance, improved risk management, and enhanced consistency by trading in the direction of the prevailing trend with volatility-adjusted stop-losses.
💡 Bonus Tip
Consider using Keltner Channels in combination with volume confirmation. When price bounces off the lower band with increasing volume in an uptrend, it suggests strong buying interest and higher probability of trend continuation. This technique, documented in technical analysis literature, can significantly improve the reliability of Keltner Channels-based trading strategies.
Using the Keltner Channels indicator ensures your strategy follows trends effectively with volatility-adjusted support and resistance levels, improving entry and exit timing based on dynamic channel analysis.