Linear Regression Indicator Explanation
The Linear Regression is a statistical trend indicator that calculates the best-fit straight line through price data over a specified period using the least squares method. Developed based on statistical regression analysis principles, Linear Regression identifies the underlying trend direction and provides a smoothed trend line that minimizes the sum of squared deviations from actual prices. The indicator helps traders identify trend direction, potential support/resistance levels, and trend strength by analyzing the slope and position of the regression line relative to current price.
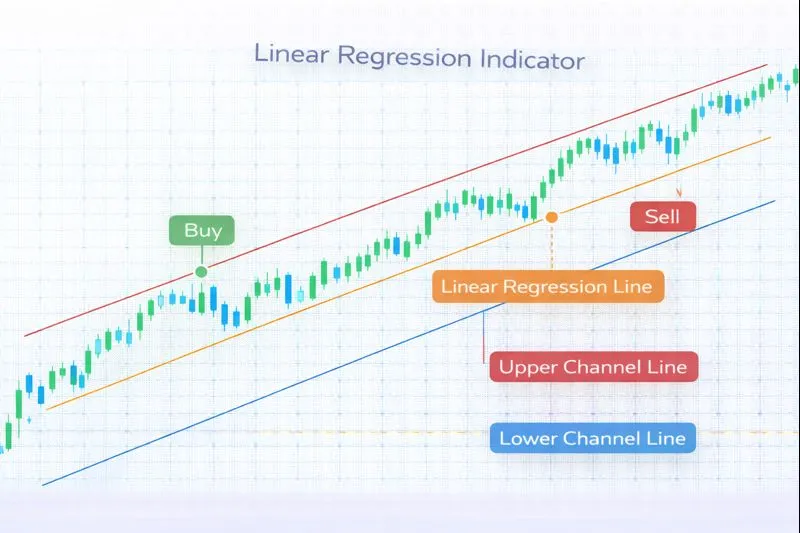
How Linear Regression Works: Linear Regression calculates a straight line (y = mx + b) that best fits the price data over a specified period, where m is the slope and b is the y-intercept. The slope indicates trend direction: positive slope indicates uptrend, negative slope indicates downtrend, and near-zero slope indicates ranging market. The regression line is calculated using the least squares method, which minimizes the sum of squared differences between actual prices and the regression line. The distance between price and the regression line indicates trend strength: prices close to the line suggest strong trend, while prices far from the line suggest weak trend or potential reversal. The Linear Regression Channel adds upper and lower bands based on standard deviation, providing dynamic support and resistance levels.
When to Use Linear Regression:
- Trend Direction Identification: Linear Regression is highly effective at identifying trend direction through the slope of the regression line. A positive slope indicates an uptrend, while a negative slope indicates a downtrend. The indicator provides a smoothed trend line that filters out short-term noise.
- Support and Resistance Levels: The Linear Regression line acts as dynamic support in uptrends and dynamic resistance in downtrends. When price deviates significantly from the regression line, it may signal potential reversal or mean reversion opportunity. The Linear Regression Channel provides upper and lower bands for support/resistance.
- Trend Strength Assessment: The distance between price and the regression line indicates trend strength. Prices consistently close to the regression line suggest a strong, stable trend, while prices far from the line suggest trend weakness or potential reversal. The R-squared value (coefficient of determination) measures how well the regression line fits the data.
Advantages:
- Provides objective trend identification through statistical analysis, eliminating subjective interpretation. The least squares method ensures mathematical accuracy in trend calculation.
- Works effectively across multiple timeframes and asset classes, including stocks, forex, commodities, and cryptocurrencies. The statistical foundation makes it reliable across different market conditions.
- Helps identify trend strength through distance from regression line and R-squared values, providing quantitative measures of trend quality. This information helps traders assess trade quality.
Limitations:
- Linear Regression assumes a linear relationship between time and price, which may not hold in all market conditions. Non-linear trends or sudden market changes can reduce the indicator's effectiveness.
- The indicator may lag behind price movements during rapid trend changes, as it relies on historical data over the specified period. This lag can result in delayed entry and exit signals.
- Linear Regression does not account for volatility or momentum, only trend direction and strength. Traders should combine it with momentum and volatility indicators for more comprehensive analysis.
In summary, Linear Regression is a valuable statistical trend indicator that provides objective trend identification and strength assessment, making it ideal for traders seeking quantitative trend analysis. For comprehensive understanding, refer to statistical analysis literature on linear regression, Investopedia's Linear Regression guide, TradingView's Linear Regression documentation, and academic research on statistical methods in technical analysis published in journals such as the Journal of Financial Markets and the Review of Financial Studies.
Practical Example: Using the Linear Regression Indicator in a Trading Strategy
The Linear Regression is a statistical trend indicator used to identify trend direction and strength through best-fit line analysis. In a trading strategy, the Linear Regression indicator helps traders make entry and exit decisions based on trend direction and price position relative to the regression line.
Scenario: You're creating a trend-following strategy for EUR/USD on a 1-hour chart. You want to buy when price is above the Linear Regression line with positive slope (indicating uptrend), and sell when price breaks below the regression line or the slope turns negative.
Strategy Logic:
- Calculate the Linear Regression(20) using a 20-period regression. The regression line provides trend direction through its slope: positive slope indicates uptrend, negative slope indicates downtrend. Price position relative to the line indicates trend strength.
- Buy signal: When price is above the Linear Regression line and the slope is positive, indicating an uptrend with price following the trend line.
- Sell signal: When price breaks below the Linear Regression line or the slope turns negative, indicating potential trend reversal or downtrend beginning.
Backtrader Example:
import backtrader as bt
import numpy as np

class LinearRegressionTrendStrategy(bt.Strategy):
    params = dict(
        regression_period=20
    )

    def __init__(self):
        self.regression_line = bt.ind.LinearRegression(self.data.close, period=self.p.regression_period)

    def next(self):
        # Calculate slope (simplified - in practice, use proper slope calculation)
        if len(self.regression_line) >= 2:
            slope = self.regression_line[0] - self.regression_line[-1]

            if not self.position:
                # Buy when price is above regression line and slope is positive
                if (self.data.close[0] > self.regression_line[0] and slope > 0):
                    self.buy()
            else:
                # Sell when price breaks below regression line or slope turns negative
                if (self.data.close[0] < self.regression_line[0] or slope < 0):
                    self.sell()

# Usage
cerebro = bt.Cerebro()
cerebro.addstrategy(LinearRegressionTrendStrategy)
Expected Outcome: By using the Linear Regression indicator, your strategy identifies trend direction objectively through statistical analysis, helping you enter trades when trends are strong and exit when trends weaken or reverse. This approach leads to better trend-following performance, improved objective trend identification, and enhanced risk management by using statistical measures of trend quality.
💡 Bonus Tip
Consider using Linear Regression Channel (with upper and lower bands based on standard deviation) for dynamic support and resistance levels. When price bounces off the lower channel band in an uptrend, it suggests strong support and higher probability of trend continuation. This technique, documented in statistical analysis literature, can significantly improve the reliability of Linear Regression-based trading strategies.
Using the Linear Regression indicator ensures your strategy identifies trends objectively through statistical analysis, improving entry and exit timing based on quantitative trend measurements.