Pivot Points Indicator Explanation
The Pivot Points are technical support and resistance levels calculated from the previous period's high, low, and close prices. Developed by floor traders in the early 20th century and widely used in futures and equity markets, Pivot Points provide key reference levels for intraday trading. The standard Pivot Point formula calculates a central pivot level and multiple support and resistance levels based on the previous period's price range. These levels act as significant psychological and technical reference points, making them valuable for identifying potential price reversals, breakouts, and intraday trading ranges.
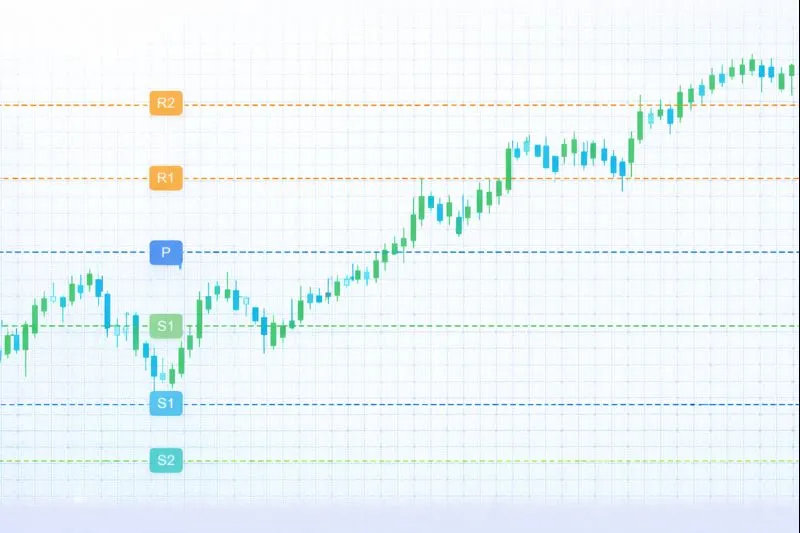
How Pivot Points Work: Pivot Points are calculated using the previous period's high, low, and close prices (typically daily, weekly, or monthly). The Central Pivot Point (PP) = (High + Low + Close) / 3. From this central point, support and resistance levels are calculated: Resistance 1 (R1) = 2 × PP - Low, Resistance 2 (R2) = PP + (High - Low), Resistance 3 (R3) = High + 2 × (PP - Low), Support 1 (S1) = 2 × PP - High, Support 2 (S2) = PP - (High - Low), and Support 3 (S3) = Low - 2 × (High - PP). Variations include Fibonacci Pivot Points, Woodie's Pivot Points, and Camarilla Pivot Points, each using different calculation methods. Price action around these levels provides trading signals: bounce off support/resistance indicates continuation, while breakouts signal trend acceleration.
When to Use Pivot Points:
- Intraday Support and Resistance: Pivot Points are highly effective for identifying key support and resistance levels in intraday trading. The Central Pivot Point acts as the primary reference, with R1-R3 providing resistance levels and S1-S3 providing support levels. Price bouncing off these levels can signal reversal or continuation opportunities.
- Range Trading and Breakout Strategies: In ranging markets, price oscillating between pivot levels (e.g., S1 and R1) can be used for range trading. Breakouts above R3 or below S3 signal strong directional moves with potential trend continuation. This makes pivot points valuable for both mean-reversion and breakout strategies.
- Multi-Timeframe Analysis: Daily pivot points are calculated from the previous day's data, while weekly and monthly pivots use weekly and monthly data respectively. Using multiple timeframes helps identify key levels across different trading horizons, providing stronger support/resistance confirmation.
Advantages:
- Provides objective support and resistance levels based on mathematical calculations, eliminating subjective interpretation. The levels are calculated daily and provide consistent reference points for traders.
- Works effectively for intraday trading across multiple asset classes, including stocks, forex, commodities, and futures. Floor traders and institutional traders widely use pivot points, making them self-fulfilling support/resistance levels.
- Helps identify trading ranges and breakout opportunities clearly. Price action around pivot levels provides immediate trading signals without requiring additional indicators or complex analysis.
Limitations:
- Pivot Points are static levels calculated at the beginning of each period (day, week, month), which means they don't adapt to changing market conditions during the trading session. Dynamic support/resistance may be more relevant in volatile markets.
- The indicator may not be as effective in trending markets where price breaks through multiple pivot levels, as the levels are based on previous period ranges. Strong trends can invalidate pivot levels quickly.
- Pivot Points do not provide information about trend direction or momentum, only price position relative to calculated levels. Traders should combine them with trend and momentum indicators for more comprehensive analysis.
In summary, Pivot Points are valuable support and resistance indicators that provide objective reference levels for intraday trading, making them ideal for traders seeking clear entry and exit points based on mathematical calculations. For comprehensive understanding, refer to floor trading literature on pivot points, Investopedia's Pivot Points guide, TradingView's Pivot Points documentation, and academic research on support and resistance levels in technical analysis published in journals such as the Journal of Financial Markets and the Review of Financial Studies.
Practical Example: Using the Pivot Points Indicator in a Trading Strategy
The Pivot Points are support and resistance levels calculated from previous period's price data. In a trading strategy, the Pivot Points indicator helps traders make entry and exit decisions based on price interactions with calculated pivot levels.
Scenario: You're creating an intraday range trading strategy for Bitcoin (BTC/USDT) on a 15-minute chart. You want to buy when price bounces off a support level (S1 or S2) and sell when price reaches a resistance level (R1 or R2), assuming price will revert within the pivot range.
Strategy Logic:
- Calculate Daily Pivot Points from the previous day's high, low, and close. The Central Pivot Point (PP) acts as the primary reference, with R1-R3 providing resistance levels and S1-S3 providing support levels. Price bouncing off these levels can signal reversal opportunities.
- Buy signal: When price bounces off a support level (S1 or S2) with bullish candlestick pattern, indicating potential upward reversal within the pivot range.
- Sell signal: When price reaches a resistance level (R1 or R2) with bearish candlestick pattern, indicating potential downward reversal within the pivot range.
Backtrader Example:
import backtrader as bt

class PivotPointsRangeStrategy(bt.Strategy):
    params = dict(
        use_weekly_pivots=False
    )

    def __init__(self):
        # Calculate pivot points from previous period
        # PP = (High + Low + Close) / 3
        # R1 = 2 * PP - Low, R2 = PP + (High - Low)
        # S1 = 2 * PP - High, S2 = PP - (High - Low)
        self.pp = None
        self.r1 = None
        self.r2 = None
        self.s1 = None
        self.s2 = None

    def next(self):
        # Calculate pivot points daily (simplified - in practice, reset daily)
        if self.pp is None or self.data.datetime.date() != self.last_date:
            high = max(self.data.high.get(size=24))  # Previous day high
            low = min(self.data.low.get(size=24))   # Previous day low
            close = self.data.close[-24] if len(self.data) >= 24 else self.data.close[0]

            self.pp = (high + low + close) / 3
            self.r1 = 2 * self.pp - low
            self.r2 = self.pp + (high - low)
            self.s1 = 2 * self.pp - high
            self.s2 = self.pp - (high - low)
            self.last_date = self.data.datetime.date()

        if not self.position:
            # Buy when price bounces off support (S1 or S2)
            if (self.data.close[0] > self.s1 and self.data.close[-1] <= self.s1) or                (self.data.close[0] > self.s2 and self.data.close[-1] <= self.s2):
                self.buy()
        else:
            # Sell when price reaches resistance (R1 or R2)
            if (self.data.close[0] >= self.r1) or (self.data.close[0] >= self.r2):
                self.sell()

# Usage
cerebro = bt.Cerebro()
cerebro.addstrategy(PivotPointsRangeStrategy)
Expected Outcome: By using the Pivot Points indicator, your strategy identifies key support and resistance levels for intraday trading, helping you enter trades when price bounces off pivot levels and exit when price reaches opposite levels. This approach leads to better range trading performance, improved entry and exit timing, and enhanced risk management by trading within established pivot ranges with clear reference levels.
💡 Bonus Tip
Consider using Pivot Points in combination with volume analysis for confirmation. When price bounces off a support level with increasing volume, it suggests strong buying interest and higher probability of reversal. This technique, documented in floor trading literature, can significantly improve the reliability of Pivot Points-based trading strategies.
Using the Pivot Points indicator ensures your strategy has clear reference levels for support and resistance, improving entry and exit timing based on mathematically calculated price levels.