SuperTrend Indicator Explanation
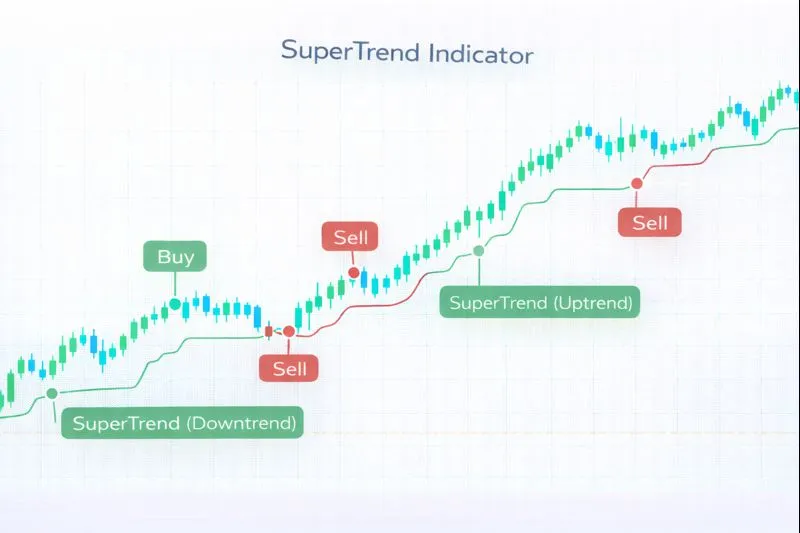
The SuperTrend is a dynamic trend-following indicator that provides clear buy and sell signals with built-in stop-loss levels. Developed by Olivier Seban and introduced in his technical analysis work, SuperTrend uses the Average True Range (ATR) to create adaptive trend lines that adjust to market volatility. The indicator consists of two lines: one for uptrends (plotted below price) and one for downtrends (plotted above price), automatically switching based on price action. SuperTrend is particularly effective in trending markets and provides traders with clear entry and exit signals without the complexity of multiple indicators.
How SuperTrend Works: SuperTrend is calculated using the ATR and a multiplier factor. First, the ATR is calculated over a specified period (typically 10 periods). Then, the basic upper and lower bands are computed: Upper Band = (High + Low) / 2 + (Multiplier × ATR), and Lower Band = (High + Low) / 2 - (Multiplier × ATR). The SuperTrend line switches between the upper and lower bands based on price action. When price closes above the SuperTrend, it flips to the lower band (uptrend), and when price closes below the SuperTrend, it flips to the upper band (downtrend). The default multiplier is typically 2.0 or 3.0, with higher values providing wider bands and fewer signals.
When to Use SuperTrend:
- Trend Following with Built-in Stop-Loss: SuperTrend is highly effective for trend-following strategies as it provides clear buy signals (when price crosses above SuperTrend) and sell signals (when price crosses below SuperTrend) with automatic stop-loss levels. The indicator adapts to volatility, making it suitable for various market conditions.
- Volatility-Adjusted Trend Identification: The use of ATR ensures that SuperTrend adapts to changing market volatility, providing wider bands in volatile markets and tighter bands in calm markets. This adaptive nature makes it more reliable than fixed-distance stop-losses.
- Multi-Timeframe Analysis: SuperTrend can be used across multiple timeframes to confirm trend direction. A bullish SuperTrend on higher timeframes combined with a bullish SuperTrend on lower timeframes provides strong trend confirmation.
Advantages:
- Provides clear, objective buy and sell signals without requiring interpretation, making it easy to implement in automated trading systems. The automatic stop-loss feature helps with risk management.
- Adapts to market volatility through ATR, ensuring that stop-losses are appropriate for current market conditions. This reduces the risk of premature stops in volatile markets.
- Works effectively in trending markets across multiple asset classes, including stocks, forex, commodities, and cryptocurrencies. The indicator is particularly useful for medium to long-term trend following.
Limitations:
- SuperTrend can produce false signals in ranging or sideways markets when price oscillates around the indicator line, leading to whipsaws and multiple small losses. The indicator works best in clearly trending markets.
- The indicator may lag behind price movements during rapid trend changes, as it relies on ATR and price closes. This lag can result in delayed entry and exit signals, potentially missing significant portions of profitable moves.
- SuperTrend does not provide information about trend strength or momentum, only trend direction. Traders should combine it with momentum indicators for more comprehensive analysis.
In summary, SuperTrend is a valuable trend-following indicator that provides clear signals with built-in stop-loss levels, making it ideal for traders seeking simplicity and effectiveness in trending markets. For comprehensive understanding, refer to Seban's original work on SuperTrend, Investopedia's SuperTrend guide, TradingView's SuperTrend documentation, and academic research on trend-following indicators in technical analysis published in journals such as the Journal of Financial Markets and the Review of Financial Studies.
Practical Example: Using the SuperTrend Indicator in a Trading Strategy
The SuperTrend is a dynamic trend-following indicator used to identify trend direction and provide automatic stop-loss levels. In a trading strategy, the SuperTrend indicator helps traders make entry and exit decisions based on trend direction with built-in risk management.
Scenario: You're creating a trend-following strategy for Bitcoin (BTC/USDT) on a 4-hour chart. You want to buy when price crosses above the SuperTrend (indicating uptrend) and sell when price crosses below the SuperTrend (indicating downtrend), using the SuperTrend line as an automatic stop-loss.
Strategy Logic:
- Calculate the SuperTrend(10, 2.0) using a 10-period ATR and a 2.0 multiplier. The SuperTrend provides clear buy signals when price crosses above it and sell signals when price crosses below it, with the line acting as a dynamic stop-loss.
- Buy signal: When price closes above the SuperTrend line, indicating an uptrend has begun. The SuperTrend line below price acts as a trailing stop-loss.
- Sell signal: When price closes below the SuperTrend line, indicating a downtrend has begun or the uptrend has ended. Exit the position immediately.
Backtrader Example:
import backtrader as bt

class SuperTrendStrategy(bt.Strategy):
    params = dict(
        atr_period=10,
        multiplier=2.0
    )

    def __init__(self):
        self.atr = bt.ind.ATR(period=self.p.atr_period)
        self.hlc3 = (self.data.high + self.data.low + self.data.close) / 3
        self.upper_band = self.hlc3 + (self.p.multiplier * self.atr)
        self.lower_band = self.hlc3 - (self.p.multiplier * self.atr)
        self.supertrend = self.upper_band  # Initialize

    def next(self):
        # Calculate SuperTrend
        hlc3 = (self.data.high[0] + self.data.low[0] + self.data.close[0]) / 3
        upper = hlc3 + (self.p.multiplier * self.atr[0])
        lower = hlc3 - (self.p.multiplier * self.atr[0])

        # Update SuperTrend based on price action
        if self.data.close[0] > self.supertrend[-1]:
            self.supertrend = lower
        else:
            self.supertrend = upper

        if not self.position:
            # Buy when price crosses above SuperTrend
            if self.data.close[0] > self.supertrend and self.data.close[-1] <= self.supertrend:
                self.buy()
        else:
            # Sell when price crosses below SuperTrend
            if self.data.close[0] < self.supertrend:
                self.sell()

# Usage
cerebro = bt.Cerebro()
cerebro.addstrategy(SuperTrendStrategy)
Expected Outcome: By using the SuperTrend indicator, your strategy follows trends with clear entry and exit signals, while the built-in stop-loss feature helps manage risk automatically. This approach leads to better trend-following performance, improved risk management, and enhanced consistency by trading in the direction of the prevailing trend with automatic stop-loss protection.
💡 Bonus Tip
Consider using SuperTrend in combination with volume confirmation. When price crosses above SuperTrend with increasing volume, it suggests strong buying interest and higher probability of trend continuation. This technique, documented in technical analysis literature, can significantly improve the reliability of SuperTrend-based trading strategies.
Using the SuperTrend indicator ensures your strategy follows trends effectively with built-in risk management, improving entry and exit timing based on dynamic trend analysis.