Pin Bar Indicator Explanation
The Pin Bar is a single-candlestick price action pattern that indicates potential price reversals by showing rejection of price levels. Also known as a "Pinocchio Bar" or "Rejection Candle," the Pin Bar has a small body (the difference between open and close) located at one end of the candle, with a long wick (shadow) extending in the opposite direction. The long wick represents price rejection, where buyers or sellers pushed price away from a specific level, only to have the price reverse and close near the opposite extreme. Pin Bars are highly regarded in price action trading for their ability to identify potential support and resistance levels and signal trend reversals.
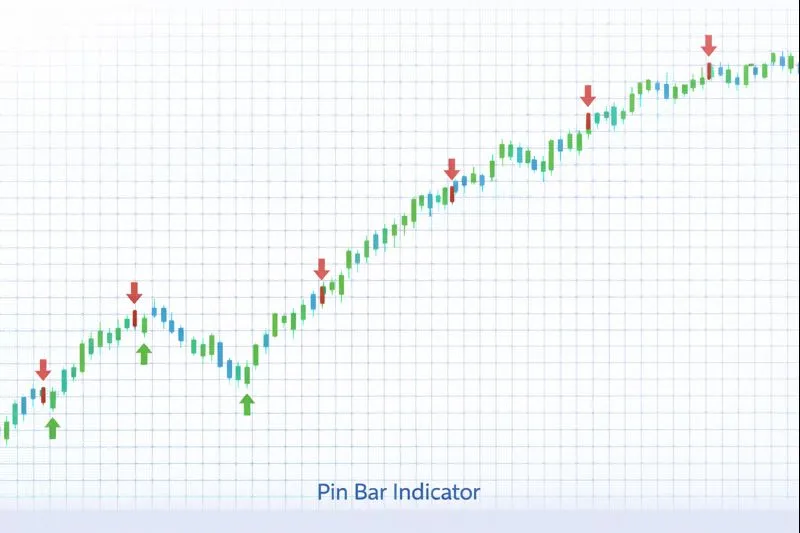
How Pin Bar Works: A Pin Bar is identified by its distinctive shape: a small body at one end with a long wick extending in the opposite direction. A bullish Pin Bar has a small body at the bottom with a long upper wick, indicating that sellers pushed price down but buyers rejected the lower prices and pushed price back up. A bearish Pin Bar has a small body at the top with a long lower wick, indicating that buyers pushed price up but sellers rejected the higher prices and pushed price back down. The length of the wick relative to the body is crucial: the wick should be at least 2-3 times the length of the body. Pin Bars are most effective when they occur at key support or resistance levels, trend lines, or Fibonacci retracement levels.
When to Use Pin Bar:
- Support and Resistance Identification: Pin Bars are highly effective at identifying potential support and resistance levels. A bullish Pin Bar at a support level indicates strong buying interest and potential upward reversal. A bearish Pin Bar at a resistance level indicates strong selling interest and potential downward reversal.
- Trend Reversal Signals: Pin Bars can signal potential trend reversals when they occur at the end of a trend. A bullish Pin Bar after a downtrend suggests potential upward reversal, while a bearish Pin Bar after an uptrend suggests potential downward reversal. The rejection of price levels indicates exhaustion of the current trend.
- Entry and Exit Signals: Pin Bars can generate entry and exit signals. A bullish Pin Bar can signal a buy entry when it forms at support, with a stop-loss below the Pin Bar's low. A bearish Pin Bar can signal a sell entry when it forms at resistance, with a stop-loss above the Pin Bar's high.
Advantages:
- Provides clear visual signals of price rejection, making it easy to identify potential reversal points. The distinctive shape makes Pin Bars easy to spot on charts.
- Works effectively across multiple timeframes and asset classes, including stocks, forex, commodities, and cryptocurrencies. The pattern is universal and reflects human psychology in trading.
- Helps identify key support and resistance levels through price rejection, providing valuable information for risk management and trade placement.
Limitations:
- Pin Bars can produce false signals in ranging markets when they occur frequently without clear directional bias. The pattern works best when combined with trend analysis and support/resistance levels.
- The indicator may require subjective interpretation to determine the significance of a Pin Bar, as not all Pin Bars are equally reliable. Context and location are crucial for effective use.
- Pin Bars alone do not provide information about trend direction or strength, only potential reversal points. Traders should combine them with other indicators for more comprehensive analysis.
In summary, Pin Bar is a valuable price action pattern that identifies potential price reversals through rejection signals, making it ideal for identifying support and resistance levels and generating entry and exit signals. For comprehensive understanding, refer to price action trading literature, including works by Steve Nison on candlestick patterns, Investopedia's Pin Bar guide, TradingView's Pin Bar documentation, and academic research on candlestick patterns in technical analysis published in journals such as the Journal of Financial Markets and the Review of Financial Studies.
Practical Example: Using the Pin Bar Indicator in a Trading Strategy
The Pin Bar is a price action pattern used to identify potential price reversals through rejection signals. In a trading strategy, the Pin Bar indicator helps traders identify support and resistance levels and generate entry and exit signals based on price rejection.
Scenario: You're creating a reversal strategy for Gold (XAU/USD) on a 4-hour chart. You want to buy when a bullish Pin Bar forms at a support level (indicating price rejection and potential upward reversal), and sell when a bearish Pin Bar forms at a resistance level (indicating price rejection and potential downward reversal).
Strategy Logic:
- Identify Pin Bar patterns: a small body with a long wick extending in the opposite direction. A bullish Pin Bar has a long upper wick with body at the bottom, while a bearish Pin Bar has a long lower wick with body at the top.
- Buy signal: When a bullish Pin Bar forms at a support level (e.g., previous low, trend line, Fibonacci retracement), indicating strong buying interest and potential upward reversal.
- Sell signal: When a bearish Pin Bar forms at a resistance level (e.g., previous high, trend line, Fibonacci retracement), indicating strong selling interest and potential downward reversal.
Backtrader Example:
import backtrader as bt

class PinBarReversalStrategy(bt.Strategy):
    params = dict(
        pin_bar_wick_ratio=2.0  # Wick must be at least 2x body
    )

    def __init__(self):
        self.support_level = None  # Set based on your analysis
        self.resistance_level = None  # Set based on your analysis

    def is_bullish_pin_bar(self, bar):
        """Check if current bar is a bullish Pin Bar"""
        body = abs(bar.close - bar.open)
        upper_wick = bar.high - max(bar.open, bar.close)
        lower_wick = min(bar.open, bar.close) - bar.low
        # Body at bottom, long upper wick
        return (body < upper_wick * 0.5 and
                upper_wick > body * self.p.pin_bar_wick_ratio and
                lower_wick < body)

    def is_bearish_pin_bar(self, bar):
        """Check if current bar is a bearish Pin Bar"""
        body = abs(bar.close - bar.open)
        upper_wick = bar.high - max(bar.open, bar.close)
        lower_wick = min(bar.open, bar.close) - bar.low
        # Body at top, long lower wick
        return (body < lower_wick * 0.5 and
                lower_wick > body * self.p.pin_bar_wick_ratio and
                upper_wick < body)

    def next(self):
        current_bar = self.data[0]

        if not self.position:
            # Buy when bullish Pin Bar at support
            if (self.is_bullish_pin_bar(current_bar) and
                self.data.low[0] <= self.support_level * 1.001):  # Within 0.1% of support
                self.buy()
        else:
            # Sell when bearish Pin Bar at resistance
            if (self.is_bearish_pin_bar(current_bar) and
                self.data.high[0] >= self.resistance_level * 0.999):  # Within 0.1% of resistance
                self.sell()

# Usage
cerebro = bt.Cerebro()
cerebro.addstrategy(PinBarReversalStrategy)
Expected Outcome: By using the Pin Bar indicator, your strategy identifies potential price reversals through rejection signals, helping you enter trades when price is rejected at key levels and exit when price is rejected at opposite levels. This approach leads to better reversal identification, improved support/resistance recognition, and enhanced entry timing by trading price rejection patterns.
💡 Bonus Tip
Consider using Pin Bars in combination with volume analysis for confirmation. When a Pin Bar forms with high volume, it suggests stronger rejection and higher probability of reversal. When a Pin Bar forms with low volume, it may be less reliable. This technique, documented in price action trading literature, can significantly improve the accuracy of Pin Bar-based trading strategies.
Using the Pin Bar indicator ensures your strategy trades price rejection patterns effectively, improving entry and exit timing based on objective price action analysis.