Fibonacci Projection Indicator Explanation
The Fibonacci Projection is a technical analysis tool based on Fibonacci ratios that identifies potential price targets by projecting the distance between two swing points (multiplied by Fibonacci ratios) from a third swing point. Fibonacci Projections are drawn using three swing points (typically swing low, swing high, and retracement point) to project potential price targets at key Fibonacci percentages (typically 100%, 161.8%, 200%, and 261.8%).
How Fibonacci Projection Works: Fibonacci Projections are calculated by identifying three swing points: the starting point (swing low), the ending point (swing high), and the projection point (retracement low). The distance between the starting and ending points is measured, then multiplied by Fibonacci ratios (100%, 161.8%, 200%, 261.8%) and projected from the projection point. This creates potential price targets where price may react, similar to Fibonacci Extensions but calculated differently.
In summary, Fibonacci Projection is a valuable price action tool that identifies potential price targets through projections based on Fibonacci ratios, making it ideal for profit target identification. For comprehensive understanding, refer to technical analysis literature, including Investopedia's Fibonacci Projection guide and TradingView's Fibonacci Projection documentation.
Practical Example: Using the Fibonacci Projection Indicator
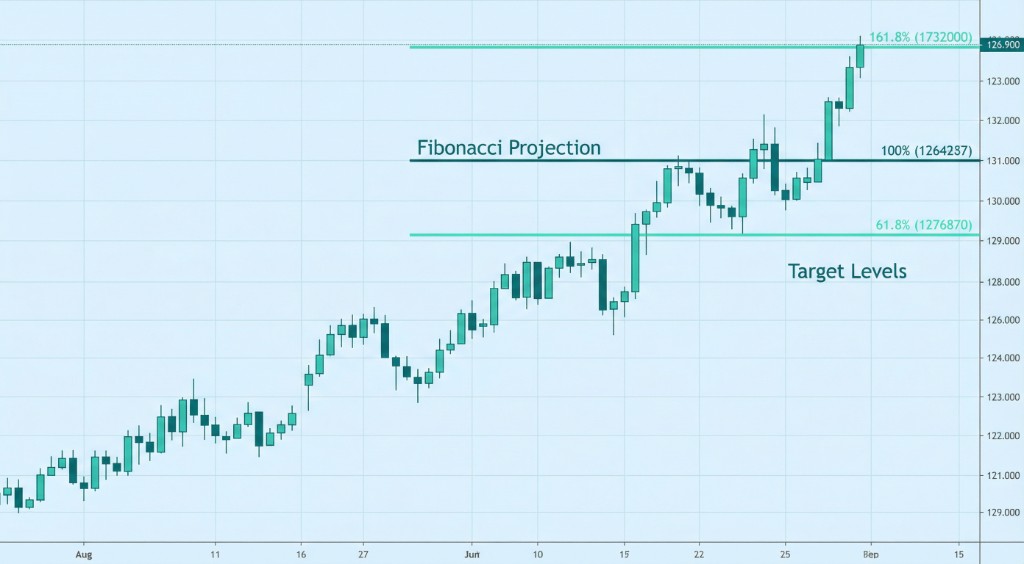
The Fibonacci Projection identifies potential price targets by projecting Fibonacci ratios from three swing points. In a trading strategy, Fibonacci Projections help traders identify profit targets based on projected price levels.
Scenario: You're creating a strategy for Gold. After identifying three swing points (swing low, swing high, retracement low), you project Fibonacci levels and set profit targets at these projected levels.
Using Fibonacci Projections ensures your strategy identifies potential profit targets effectively, improving exit timing.