Volume Indicator Explanation
The Volume indicator is one of the most fundamental and widely used tools in technical analysis, measuring the number of shares, contracts, or units traded during a specified period. While volume analysis has been a cornerstone of technical analysis since the early 20th century, popularized by pioneers like Charles Dow and Richard Wyckoff, the Volume indicator provides traders with critical insights into market participation, trend confirmation, and potential price reversals. Volume represents the total trading activity for an asset, helping traders understand the strength behind price movements and identify whether trends are supported by genuine market interest or are merely weak price fluctuations.
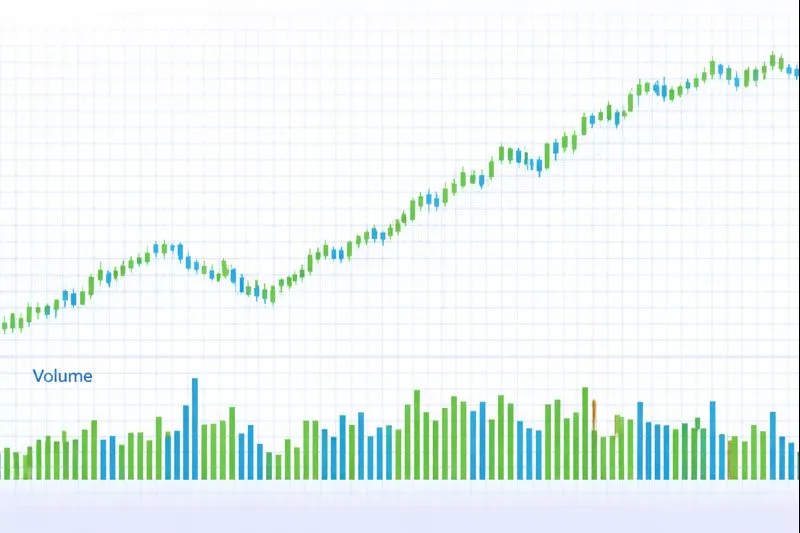
How Volume Works: Volume is calculated by summing the total number of shares, contracts, or units traded during each period (e.g., per bar or candle). For example, on a 1-hour chart, volume represents the total trading activity during that hour. Volume is typically displayed as a histogram below the price chart, with each bar representing the volume for that period. Higher volume bars indicate greater trading activity, while lower volume bars indicate less trading activity. Volume analysis involves comparing current volume to historical volume averages and observing volume patterns relative to price movements. When price moves are accompanied by high volume, it suggests strong conviction, while price moves on low volume may indicate weak participation and potential reversals.
When to Use Volume:
- Trend Confirmation: Volume is highly effective at confirming trend strength and direction. In uptrends, increasing volume on up moves and decreasing volume on down moves confirms bullish momentum. Conversely, in downtrends, increasing volume on down moves and decreasing volume on up moves confirms bearish momentum. Volume divergence (price making new highs with declining volume) can signal weakening trends.
- Breakout Validation: Volume helps validate price breakouts from support or resistance levels. A breakout accompanied by high volume is more likely to be genuine and sustainable, while a breakout on low volume may be a false signal. Traders use volume to distinguish between real breakouts and false breakouts.
- Reversal Identification: Unusual volume spikes often precede significant price reversals. When price reaches new highs or lows with exceptionally high volume, it may indicate exhaustion and potential reversal. Volume analysis helps identify accumulation (buying pressure) and distribution (selling pressure) phases in the market.
Advantages:
- Provides objective confirmation of price movements, helping traders distinguish between strong and weak trends. Volume analysis adds a crucial dimension to price action, revealing the level of market participation behind price moves.
- Works across all markets and timeframes, including stocks, forex, commodities, and cryptocurrencies, as volume measurement is universal. The indicator is particularly valuable for confirming the validity of price patterns and chart formations.
- Helps identify potential reversals and trend changes through volume divergence and unusual volume patterns. Volume spikes often signal important market events and can help traders anticipate significant price movements.
Limitations:
- Volume data may not be available or reliable for all markets, particularly in forex markets where centralized volume data is limited. In such cases, traders may use tick volume or alternative volume proxies.
- Volume alone does not indicate price direction, only the level of trading activity. High volume can accompany both price increases and decreases, requiring interpretation in context with price action.
- Volume patterns can be subjective and require experience to interpret correctly. Different volume patterns may have different meanings depending on market context and timeframe.
In summary, Volume is an essential indicator for traders seeking to confirm trend strength, validate breakouts, and identify potential reversals through market participation analysis. For comprehensive understanding, refer to technical analysis literature on volume analysis, including the work of Richard Wyckoff and Charles Dow, Investopedia's Volume guide, TradingView's Volume documentation, and academic research on volume-price relationships in financial markets published in journals such as the Journal of Finance and the Review of Financial Studies.
Practical Example: Using the Volume Indicator in a Trading Strategy
The Volume indicator is a fundamental tool used to measure trading activity and confirm price movements by analyzing the number of shares, contracts, or units traded during a specified period. In a trading strategy, the Volume indicator helps traders validate breakouts, confirm trends, and identify potential reversals through volume analysis.
Scenario: You're creating a breakout strategy for Gold (XAU/USD) on a 4-hour chart. You want to enter trades only when price breaks above a resistance level with high volume (indicating strong buying interest), and exit when volume declines significantly (indicating weakening momentum).
Strategy Logic:
- Calculate the Volume and compare it to a moving average of volume (e.g., 20-period volume moving average) to identify above-average trading activity. High volume indicates strong market participation, while low volume suggests weak interest.
- Buy signal: When price breaks above a key resistance level and volume is significantly above the 20-period average, indicating strong buying pressure and genuine breakout.
- Sell signal: When volume drops below the 20-period average after a price move, indicating weakening momentum and potential trend exhaustion.
Backtrader Example:
import backtrader as bt

class VolumeBreakoutStrategy(bt.Strategy):
    params = dict(
        volume_ma_period=20,
        volume_threshold=1.5  # Volume must be 1.5x average
    )

    def __init__(self):
        self.volume = self.data.volume
        self.volume_ma = bt.ind.SMA(self.volume, period=self.p.volume_ma_period)
        self.resistance_level = None  # Set based on your analysis

    def next(self):
        if not self.position:
            # Buy when price breaks resistance with high volume
            if (self.data.close[0] > self.resistance_level and
                self.volume[0] > self.volume_ma[0] * self.p.volume_threshold):
                self.buy()
        else:
            # Sell when volume drops significantly
            if self.volume[0] < self.volume_ma[0] * 0.7:
                self.sell()

# Usage
cerebro = bt.Cerebro()
cerebro.addstrategy(VolumeBreakoutStrategy)
Expected Outcome: By using the Volume indicator, your strategy validates breakouts and confirms trend strength, helping you enter trades when market participation is strong and exit when interest wanes. This approach leads to better breakout validation, improved trend confirmation, and enhanced risk management by avoiding trades during low-volume, unreliable market conditions.
💡 Bonus Tip
Consider using volume divergence as a reversal signal. When price makes a new high but volume makes a lower high, it suggests weakening buying pressure and potential bearish reversal. This technique, documented in volume analysis literature, can significantly improve the accuracy of volume-based trading strategies by identifying trend exhaustion before price reversals occur.
Using the Volume indicator ensures your strategy trades with strong market participation, improving entry and exit timing based on objective volume analysis.