Volume Oscillator Indicator Explanation
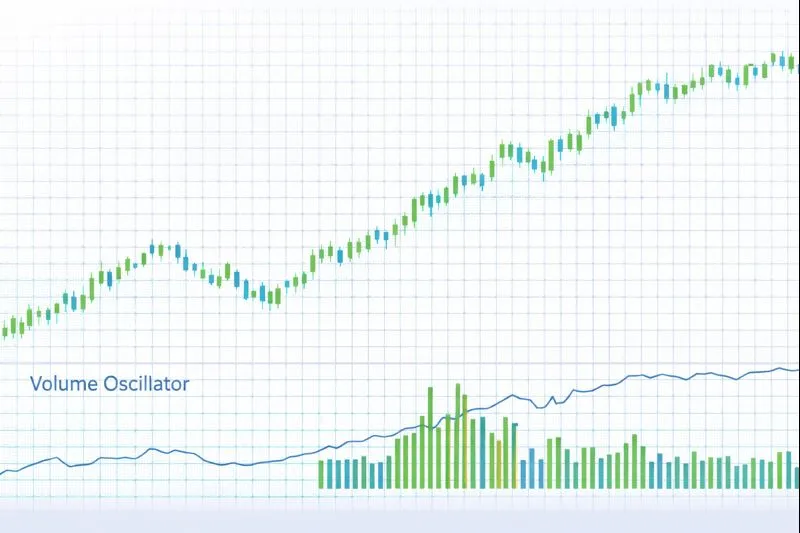
The Volume Oscillator is a momentum indicator that measures the difference between two volume moving averages, expressed as a percentage or absolute value. Developed to identify volume trends and momentum shifts, the Volume Oscillator compares a short-term volume moving average (typically 5-14 periods) to a long-term volume moving average (typically 20-30 periods), creating an oscillator that oscillates around a zero line. Positive values indicate that short-term volume is above long-term average (increasing volume momentum), while negative values indicate that short-term volume is below long-term average (decreasing volume momentum). The Volume Oscillator helps traders identify volume divergences, confirm price movements, and anticipate potential reversals.
How Volume Oscillator Works: Volume Oscillator is calculated by subtracting a long-term volume moving average from a short-term volume moving average, then expressing the result as a percentage or ratio. The formula is: Volume Oscillator = ((Short-Term Volume MA - Long-Term Volume MA) / Long-Term Volume MA) × 100, or simply Volume Oscillator = Short-Term Volume MA - Long-Term Volume MA. When the oscillator is positive and rising, it indicates increasing volume momentum and strong market participation. When the oscillator is negative and falling, it indicates decreasing volume momentum and weak market participation. The oscillator oscillates around zero, with values above zero indicating above-average volume and values below zero indicating below-average volume.
When to Use Volume Oscillator:
- Volume Trend Identification: Volume Oscillator is highly effective at identifying volume trends and momentum shifts. Rising Volume Oscillator indicates increasing volume momentum and strong market participation, while falling Volume Oscillator indicates decreasing volume momentum and weak market participation. The oscillator helps traders distinguish between strong and weak price movements.
- Divergence Analysis: Volume Oscillator divergence occurs when price makes new highs or lows while the oscillator fails to confirm, often signaling potential trend reversals. Bullish divergence (price makes lower low, Volume Oscillator makes higher low) suggests increasing buying interest, while bearish divergence (price makes higher high, Volume Oscillator makes lower high) suggests decreasing buying interest.
- Breakout Confirmation: Volume Oscillator can confirm the validity of price breakouts. When price breaks above resistance with Volume Oscillator rising above zero, it indicates strong volume support and genuine breakout. Conversely, when price breaks below support with Volume Oscillator falling below zero, it indicates strong volume support for the breakdown.
Advantages:
- Provides clear identification of volume trends and momentum shifts through moving average comparison, making it easy to interpret volume conditions. The oscillator format normalizes volume differences across different assets.
- Works effectively across multiple timeframes and asset classes, including stocks, forex, commodities, and cryptocurrencies. The relative comparison makes it universally applicable.
- Helps identify volume divergences and anticipate potential reversals, as volume momentum often precedes price momentum changes. The oscillator format improves reliability.
Limitations:
- Volume Oscillator requires reliable volume data, which may not be available or accurate in all markets, particularly in forex markets where volume data can be less reliable. The indicator's effectiveness depends on the quality of volume information.
- The indicator may lag behind rapid volume changes, as it relies on moving average calculations. This lag can result in delayed signals, especially during sudden volume spikes.
- Volume Oscillator alone does not provide specific entry or exit signals, only volume momentum measurement. Traders should use it in combination with price action and other indicators for comprehensive analysis.
In summary, Volume Oscillator is a valuable volume indicator that provides volume momentum measurement through moving average comparison, making it ideal for identifying volume trends, confirming price movements, and anticipating potential reversals. For comprehensive understanding, refer to technical analysis literature on volume oscillators, Investopedia's Volume Oscillator guide, TradingView's Volume Oscillator documentation, and academic research on volume-price relationships in financial markets published in journals such as the Journal of Finance and the Review of Financial Studies.
Practical Example: Using the Volume Oscillator Indicator in a Trading Strategy
The Volume Oscillator is a volume momentum indicator used to identify volume trends and confirm price movements through moving average comparison. In a trading strategy, the Volume Oscillator indicator helps traders validate breakouts, confirm trends, and identify potential reversals through volume momentum analysis.
Scenario: You're creating a breakout strategy for Bitcoin (BTC/USDT) on a 4-hour chart. You want to enter trades when price breaks above resistance with Volume Oscillator rising above zero (indicating strong volume support), and exit when Volume Oscillator falls below zero (indicating weakening volume momentum).
Strategy Logic:
- Calculate the Volume Oscillator(5, 20) using a 5-period short-term volume MA and a 20-period long-term volume MA. The oscillator oscillates around zero, with positive values indicating above-average volume and negative values indicating below-average volume.
- Buy signal: When price breaks above resistance and Volume Oscillator crosses above zero, indicating strong volume support and genuine breakout with increasing volume momentum.
- Sell signal: When Volume Oscillator falls below zero or when price reaches a target, indicating weakening volume momentum or trade completion.
Backtrader Example:
import backtrader as bt

class VolumeOscillatorBreakoutStrategy(bt.Strategy):
    params = dict(
        short_period=5,
        long_period=20
    )

    def __init__(self):
        # Calculate Volume Oscillator: Short Volume MA - Long Volume MA
        self.volume_short = bt.ind.SMA(self.data.volume, period=self.p.short_period)
        self.volume_long = bt.ind.SMA(self.data.volume, period=self.p.long_period)
        self.volume_oscillator = self.volume_short - self.volume_long
        self.resistance_level = None  # Set based on your analysis

    def next(self):
        if not self.position:
            # Buy when price breaks resistance and Volume Oscillator crosses above zero
            if (self.data.close[0] > self.resistance_level and
                self.volume_oscillator[0] > 0 and
                self.volume_oscillator[-1] <= 0):
                self.buy()
        else:
            # Sell when Volume Oscillator falls below zero or target reached
            if (self.volume_oscillator[0] < 0 or self._target_reached()):
                self.sell()

    def _target_reached(self):
        # Add target logic
        return False

# Usage
cerebro = bt.Cerebro()
cerebro.addstrategy(VolumeOscillatorBreakoutStrategy)
Expected Outcome: By using the Volume Oscillator indicator, your strategy validates breakouts and confirms trend strength through volume momentum analysis, helping you enter trades when volume support is strong and exit when volume momentum weakens. This approach leads to better breakout validation, improved trend confirmation, and enhanced signal reliability by requiring volume confirmation for price movements.
💡 Bonus Tip
Consider using Volume Oscillator divergence as a reversal signal. When price makes a new high but Volume Oscillator makes a lower high, it suggests weakening volume support despite higher prices, often preceding bearish reversals. This technique, documented in volume analysis literature, can significantly improve the accuracy of Volume Oscillator-based trading strategies.
Using the Volume Oscillator indicator ensures your strategy trades with strong volume momentum confirmation, improving entry and exit timing based on objective volume trend analysis.