Volume Rate of Change Indicator Explanation
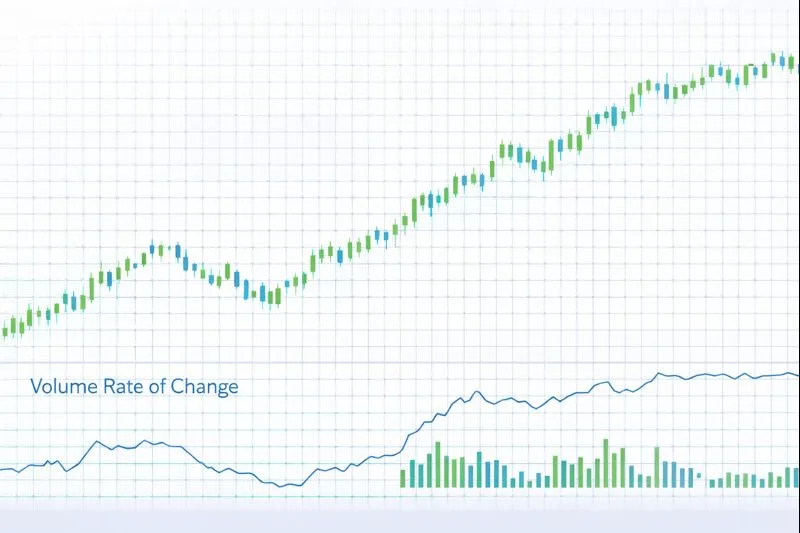
The Volume Rate of Change (VROC) is a momentum indicator that measures the percentage change in volume over a specified period, similar to the Price Rate of Change (ROC) but applied to volume data. Developed to identify volume momentum and acceleration, VROC compares current volume to volume from a specified number of periods ago and expresses the change as a percentage. The indicator oscillates around a zero line, with positive values indicating increasing volume momentum and negative values indicating decreasing volume momentum. VROC helps traders identify volume acceleration, confirm price movements, and anticipate potential reversals through volume momentum analysis.
How Volume Rate of Change Works: VROC is calculated by comparing current volume to volume from a specified number of periods ago and expressing the change as a percentage. The formula is: VROC = ((Current Volume - Volume n periods ago) / Volume n periods ago) × 100, where n is typically 12 or 25 periods. The result oscillates around zero, with positive values indicating that current volume is higher than volume n periods ago (increasing volume momentum), and negative values indicating that current volume is lower (decreasing volume momentum). The magnitude of VROC indicates the strength of volume momentum: larger positive or negative values suggest stronger volume acceleration or deceleration.
When to Use Volume Rate of Change:
- Volume Momentum Identification: VROC is highly effective at identifying volume momentum and acceleration. Positive and rising VROC indicates increasing volume momentum and strong market participation, while negative and falling VROC indicates decreasing volume momentum and weak market participation. The percentage format makes volume changes comparable across different assets.
- Price Movement Confirmation: VROC can confirm the strength of price movements. When price rises with positive and increasing VROC, it indicates strong volume support and genuine price movement. Conversely, when price rises with negative or decreasing VROC, it suggests weak volume support and potential reversal.
- Divergence Analysis: VROC divergence occurs when price makes new highs or lows while VROC fails to confirm, often signaling potential trend reversals. Bullish divergence (price makes lower low, VROC makes higher low) suggests increasing buying interest, while bearish divergence (price makes higher high, VROC makes lower high) suggests decreasing buying interest.
Advantages:
- Provides clear identification of volume momentum through percentage change analysis, making it easy to compare volume acceleration across different assets and timeframes. The percentage format normalizes volume differences.
- Works effectively across multiple timeframes and asset classes, including stocks, forex, commodities, and cryptocurrencies. The relative comparison makes it universally applicable.
- Helps identify volume acceleration and anticipate potential reversals, as volume momentum often precedes price momentum changes. The percentage calculation improves reliability.
Limitations:
- VROC requires reliable volume data, which may not be available or accurate in all markets, particularly in forex markets where volume data can be less reliable. The indicator's effectiveness depends on the quality of volume information.
- The indicator may produce false signals in ranging markets when volume oscillates around average levels without clear directional bias. VROC works best in trending markets where volume momentum is more clearly defined.
- VROC alone does not provide specific entry or exit signals, only volume momentum measurement. Traders should use it in combination with price action and other indicators for comprehensive analysis.
In summary, Volume Rate of Change is a valuable volume indicator that provides volume momentum measurement through percentage change analysis, making it ideal for identifying volume acceleration, confirming price movements, and anticipating potential reversals. For comprehensive understanding, refer to technical analysis literature on volume momentum indicators, Investopedia's Volume Rate of Change guide, and academic research on volume-price relationships in financial markets published in journals such as the Journal of Finance and the Review of Financial Studies.
Practical Example: Using the Volume Rate of Change Indicator in a Trading Strategy
The Volume Rate of Change (VROC) is a volume momentum indicator used to identify volume acceleration and confirm price movements through percentage change analysis. In a trading strategy, the VROC indicator helps traders validate breakouts, confirm trends, and identify potential reversals through volume momentum analysis.
Scenario: You're creating a trend-following strategy for EUR/USD on a 4-hour chart. You want to enter trades when price is rising with positive and increasing VROC (indicating strong volume support), and exit when VROC becomes negative or decreasing (indicating weakening volume momentum).
Strategy Logic:
- Calculate the VROC(12) using a 12-period lookback. VROC measures the percentage change in volume, with positive values indicating increasing volume momentum and negative values indicating decreasing volume momentum.
- Buy signal: When price is in an uptrend and VROC crosses above zero and continues to rise, indicating strong volume support and increasing volume momentum.
- Sell signal: When VROC crosses below zero or falls significantly, indicating weakening volume momentum and potential trend exhaustion.
Backtrader Example:
import backtrader as bt

class VROCTrendStrategy(bt.Strategy):
    params = dict(
        vroc_period=12
    )

    def __init__(self):
        # Calculate VROC: ((Current Volume - Volume n periods ago) / Volume n periods ago) * 100
        self.vroc = bt.ind.ROC(self.data.volume, period=self.p.vroc_period)

    def next(self):
        if not self.position:
            # Buy when VROC crosses above zero and rising
            if (self.vroc[0] > 0 and self.vroc[0] > self.vroc[-1] and
                self.vroc[-1] <= 0):
                self.buy()
        else:
            # Sell when VROC crosses below zero or falling
            if (self.vroc[0] < 0 or
                (self.vroc[0] < self.vroc[-1] and self.vroc[-1] >= 0)):
                self.sell()

# Usage
cerebro = bt.Cerebro()
cerebro.addstrategy(VROCTrendStrategy)
Expected Outcome: By using the VROC indicator, your strategy validates price movements and confirms trend strength through volume momentum analysis, helping you enter trades when volume support is strong and exit when volume momentum weakens. This approach leads to better trend confirmation, improved signal reliability, and enhanced entry timing by requiring volume acceleration for price movements.
💡 Bonus Tip
Consider using VROC in combination with price momentum indicators like RSI for confirmation. When both VROC and RSI are positive and rising, it suggests strong momentum in both price and volume, indicating higher probability of trend continuation. This technique, documented in volume analysis literature, can significantly improve the accuracy of VROC-based trading strategies.
Using the VROC indicator ensures your strategy trades with strong volume momentum confirmation, improving entry and exit timing based on objective volume acceleration analysis.