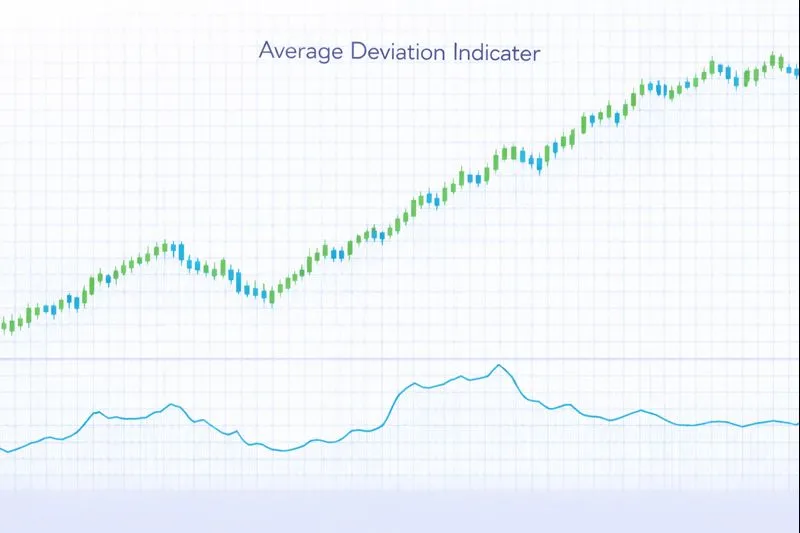
Average Deviation Indicator Explanation
The Average Deviation (also known as Mean Absolute Deviation or MAD) is a statistical volatility indicator that measures the average absolute difference between each price value and the mean price over a specified period. Unlike Standard Deviation, which squares the differences, Average Deviation uses absolute values, making it less sensitive to outliers and providing a simpler, more intuitive measure of price dispersion. Higher Average Deviation values indicate greater price volatility (prices deviate more from the mean), while lower values indicate lower volatility (prices are closer to the mean).
How Average Deviation Works: Average Deviation is calculated by first computing the mean (average) of closing prices over a specified period (typically 20 periods), then calculating the absolute difference between each price and the mean, and finally averaging these absolute differences. The formula is: Mean = Σ(Close) / n, and Average Deviation = Σ|Close - Mean| / n, where n is the period. This statistical measure provides a straightforward representation of price volatility: values near zero indicate low volatility (prices are close to the mean), while higher values indicate high volatility (prices are spread out from the mean). Average Deviation is less influenced by extreme price movements than Standard Deviation, making it more stable in volatile markets.
When to Use Average Deviation:
- Volatility Assessment: Average Deviation is highly effective at identifying periods of high and low volatility with less sensitivity to outliers than Standard Deviation. Rising Average Deviation indicates increasing volatility, while falling Average Deviation indicates decreasing volatility and potential market consolidation.
- Risk Management: Average Deviation can be used to adjust position sizes and stop-loss levels based on current volatility, similar to Standard Deviation but with greater stability. Higher volatility requires wider stops and smaller position sizes.
- Breakout and Reversal Identification: Low Average Deviation periods (volatility contraction) often precede significant breakouts or reversals, as periods of low volatility are typically followed by periods of high volatility. Rising Average Deviation during a breakout confirms strong price movement.
Advantages:
- Provides a clear, objective measure of price volatility through simple statistical analysis, making it easier to interpret than Standard Deviation. The absolute value calculation ensures stability.
- Less sensitive to outliers than Standard Deviation, making it more stable in volatile markets with extreme price movements. The absolute difference approach provides more intuitive volatility measurement.
- Works effectively across multiple timeframes and asset classes, including stocks, forex, commodities, and cryptocurrencies. The mathematical simplicity ensures reliability.
Limitations:
- Average Deviation does not indicate price direction or trend strength, only the magnitude of price dispersion around the mean. Traders must combine it with directional indicators for entry and exit signals.
- The indicator may lag behind rapid volatility changes, as it relies on historical price data. The calculation uses a moving average of absolute differences, which can delay response to sudden volatility spikes.
- Average Deviation alone does not provide specific entry or exit signals, only volatility measurement. Traders should use it in combination with other indicators for comprehensive analysis.
In summary, Average Deviation is a valuable volatility indicator that provides a stable, intuitive measurement of price dispersion, making it ideal for risk management and volatility assessment with less sensitivity to outliers than Standard Deviation. For comprehensive understanding, refer to statistical analysis literature on mean absolute deviation, Investopedia's Average Deviation guide, and academic research on volatility measurement in financial markets published in journals such as the Journal of Financial Markets and Quantitative Finance journals.
Practical Example: Using the Average Deviation Indicator in a Trading Strategy
The Average Deviation is a volatility indicator used to measure price dispersion and assess market volatility through absolute difference analysis. In a trading strategy, the Average Deviation indicator helps traders adjust risk management and identify periods of volatility contraction and expansion.
Scenario: You're creating a volatility-based position sizing strategy for Bitcoin (BTC/USDT) on a daily chart. You want to adjust position sizes based on Average Deviation: smaller positions during high volatility periods and larger positions during low volatility periods.
Strategy Logic:
- Calculate the Average Deviation(20) using a 20-period calculation of closing prices. Average Deviation measures price dispersion around the mean using absolute differences, with low values indicating low volatility and high values indicating high volatility.
- Position sizing: When Average Deviation is above a threshold (high volatility), reduce position size to 50% of normal size. When Average Deviation is below a threshold (low volatility), use normal position size.
- Stop-loss adjustment: Set stop-loss at 2× Average Deviation below entry price for long positions and 2× Average Deviation above entry price for short positions, adjusting dynamically to volatility.
Backtrader Example:
import backtrader as bt
import numpy as np

class AverageDeviationPositionSizingStrategy(bt.Strategy):
    params = dict(
        ad_period=20,
        volatility_threshold=1.5,
        stop_multiplier=2.0
    )

    def __init__(self):
        # Calculate Average Deviation: mean absolute deviation
        self.sma = bt.ind.SMA(self.data.close, period=self.p.ad_period)
        # Simplified: calculate absolute differences and average
        self.price_diff = bt.ind.AbsDifference(self.data.close, self.sma)
        self.avg_dev = bt.ind.SMA(self.price_diff, period=self.p.ad_period)
        self.avg_ad = bt.ind.SMA(self.avg_dev, period=20)  # Average of AD

    def next(self):
        if not self.position:
            # Calculate position size based on volatility
            if self.avg_dev[0] > self.avg_ad[0] * self.p.volatility_threshold:
                # High volatility: smaller position
                size = self.broker.getcash() * 0.01  # 1% of cash
            else:
                # Low volatility: normal position
                size = self.broker.getcash() * 0.02  # 2% of cash

            if self._entry_signal():
                self.buy(size=size)
        else:
            # Dynamic stop-loss based on Average Deviation
            stop_distance = self.avg_dev[0] * self.p.stop_multiplier
            if self.position.size > 0:  # Long position
                stop_price = self.data.close[0] - stop_distance
            else:  # Short position
                stop_price = self.data.close[0] + stop_distance

            if self._stop_triggered(stop_price):
                self.close()

    def _entry_signal(self):
        # Add entry logic
        return False

    def _stop_triggered(self, stop_price):
        # Add stop logic
        return False

# Usage
cerebro = bt.Cerebro()
cerebro.addstrategy(AverageDeviationPositionSizingStrategy)
Expected Outcome: By using the Average Deviation indicator, your strategy adjusts position sizes and stop-loss levels based on current volatility, helping you manage risk more effectively by reducing exposure during high volatility and maximizing exposure during low volatility. This approach leads to better risk management, improved position sizing, and enhanced stability in volatile markets.
💡 Bonus Tip
Consider using Average Deviation in combination with other volatility indicators like ATR for confirmation. When both Average Deviation and ATR show low volatility, it suggests strong consolidation and potential for significant breakout. When both show high volatility, it confirms strong market movement. This technique, documented in risk management literature, can significantly improve the effectiveness of volatility-based trading strategies.
Using the Average Deviation indicator ensures your strategy adapts to volatility cycles with greater stability, improving risk management based on absolute deviation analysis.