Volatility Ratio Indicator Explanation
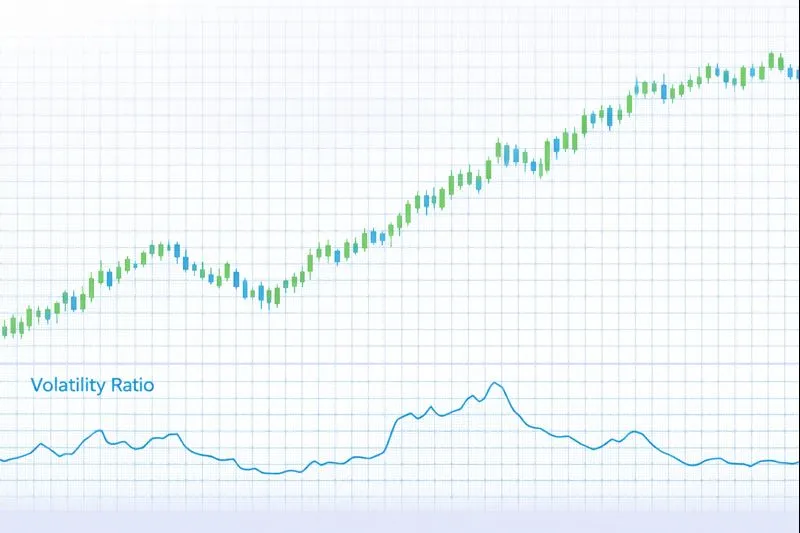
The Volatility Ratio is a volatility indicator that compares current volatility to historical volatility by dividing a short-term volatility measure by a long-term volatility measure. Developed by Jack Schwager in his book "Technical Analysis" (1999), the Volatility Ratio helps identify periods when current volatility is unusually high or low relative to historical norms. The indicator typically uses the True Range or Standard Deviation as the volatility measure, comparing a short period (typically 14 periods) to a longer period (typically 28 periods). Values above 1.0 indicate that current volatility is higher than historical average, while values below 1.0 indicate that current volatility is lower than historical average.
How Volatility Ratio Works: Volatility Ratio is calculated by dividing a short-term volatility measure by a long-term volatility measure. The formula is: Volatility Ratio = Short-Term Volatility / Long-Term Volatility, where volatility can be measured using True Range (TR), Standard Deviation, or Average True Range (ATR). For example, using ATR: Volatility Ratio = ATR(14) / ATR(28). When the ratio is above 1.0, it indicates that recent volatility (14-period) is higher than longer-term volatility (28-period), suggesting increased market activity. When the ratio is below 1.0, it indicates that recent volatility is lower than longer-term volatility, suggesting decreased market activity and potential consolidation.
When to Use Volatility Ratio:
- Volatility Normalization Assessment: Volatility Ratio is highly effective at identifying when current volatility deviates from historical norms. Values above 1.0 indicate above-average volatility, while values below 1.0 indicate below-average volatility. This helps traders adjust expectations and risk management accordingly.
- Breakout Anticipation: Low Volatility Ratio values (below 0.8-0.9) often precede significant breakouts, as periods of low volatility are typically followed by periods of high volatility. Rising Volatility Ratio after a low period confirms volatility expansion and potential price movement.
- Risk Management: Volatility Ratio can be used to adjust position sizes and stop-loss levels based on relative volatility. When the ratio is high (above 1.2-1.5), reduce position sizes and widen stops. When the ratio is low (below 0.8), consider tighter stops and larger positions.
Advantages:
- Provides a relative measure of volatility that normalizes for different assets and timeframes, making it easy to compare volatility conditions across markets. The ratio format eliminates absolute value differences.
- Works effectively across multiple timeframes and asset classes, including stocks, forex, commodities, and cryptocurrencies. The relative comparison makes it universally applicable.
- Helps identify volatility extremes and anticipate market movements, as low volatility periods often precede high volatility periods. The ratio format improves reliability.
Limitations:
- Volatility Ratio does not indicate price direction or trend strength, only the relative level of volatility compared to historical norms. Traders must combine it with directional indicators for entry and exit signals.
- The indicator may lag behind rapid volatility changes, as it relies on historical volatility measurements. The calculation uses moving averages, which can delay response to sudden volatility spikes.
- Volatility Ratio alone does not provide specific entry or exit signals, only relative volatility measurement. Traders should use it in combination with other indicators for comprehensive analysis.
In summary, Volatility Ratio is a valuable volatility indicator that provides relative volatility measurement by comparing current volatility to historical volatility, making it ideal for risk management, volatility normalization assessment, and identifying periods of volatility contraction and expansion. For comprehensive understanding, refer to Schwager's original work "Technical Analysis" (1999), Investopedia's Volatility Ratio guide, and academic research on volatility measurement in financial markets published in journals such as the Journal of Financial Markets and Quantitative Finance journals.
Practical Example: Using the Volatility Ratio Indicator in a Trading Strategy
The Volatility Ratio is a volatility indicator used to compare current volatility to historical volatility through relative measurement. In a trading strategy, the Volatility Ratio indicator helps traders adjust risk management and identify periods of volatility normalization and expansion.
Scenario: You're creating a breakout strategy for Gold (XAU/USD) on a daily chart. You want to enter trades when Volatility Ratio is low (below 0.8, indicating volatility contraction) and rises above 1.0 (indicating volatility expansion and potential breakout), assuming that low volatility periods often precede significant price movements.
Strategy Logic:
- Calculate the Volatility Ratio using ATR(14) / ATR(28). The ratio compares short-term volatility (14 periods) to long-term volatility (28 periods). Values above 1.0 indicate above-average volatility, while values below 1.0 indicate below-average volatility.
- Buy signal: When Volatility Ratio crosses above 1.0 after being below 0.8 (volatility expansion after contraction), indicating potential breakout with increasing volatility.
- Sell signal: When Volatility Ratio falls below 0.8 or when price reaches a target, indicating volatility normalization or trade completion.
Backtrader Example:
import backtrader as bt

class VolatilityRatioBreakoutStrategy(bt.Strategy):
    params = dict(
        short_period=14,
        long_period=28,
        low_threshold=0.8,
        high_threshold=1.0
    )

    def __init__(self):
        # Calculate Volatility Ratio: Short ATR / Long ATR
        self.atr_short = bt.ind.ATR(period=self.p.short_period)
        self.atr_long = bt.ind.ATR(period=self.p.long_period)
        self.volatility_ratio = self.atr_short / self.atr_long
        self.low_volatility = False

    def next(self):
        # Track low volatility period
        if self.volatility_ratio[0] < self.p.low_threshold:
            self.low_volatility = True

        if not self.position:
            # Buy when Volatility Ratio expands above threshold after low period
            if (self.low_volatility and
                self.volatility_ratio[0] > self.p.high_threshold and
                self.volatility_ratio[-1] <= self.p.high_threshold):
                self.buy()
                self.low_volatility = False
        else:
            # Sell when Volatility Ratio contracts or target reached
            if (self.volatility_ratio[0] < self.p.low_threshold or
                self._target_reached()):
                self.sell()

    def _target_reached(self):
        # Add target logic
        return False

# Usage
cerebro = bt.Cerebro()
cerebro.addstrategy(VolatilityRatioBreakoutStrategy)
Expected Outcome: By using the Volatility Ratio indicator, your strategy identifies volatility expansion periods that often precede significant price movements, helping you enter trades when volatility increases after consolidation. This approach leads to better breakout identification, improved risk management, and enhanced entry timing by trading volatility normalization cycles.
💡 Bonus Tip
Consider using Volatility Ratio in combination with price action analysis for confirmation. When Volatility Ratio is low and price forms a consolidation pattern (e.g., triangle, rectangle), it suggests strong potential for breakout. When Volatility Ratio expands above 1.0 after consolidation, it confirms strong price movement with higher probability of continuation. This technique, documented in Schwager's original methodology, can significantly improve the accuracy of Volatility Ratio-based trading strategies.
Using the Volatility Ratio indicator ensures your strategy adapts to volatility normalization cycles, improving entry and exit timing based on relative volatility measurement.