Standard Deviation Indicator Explanation
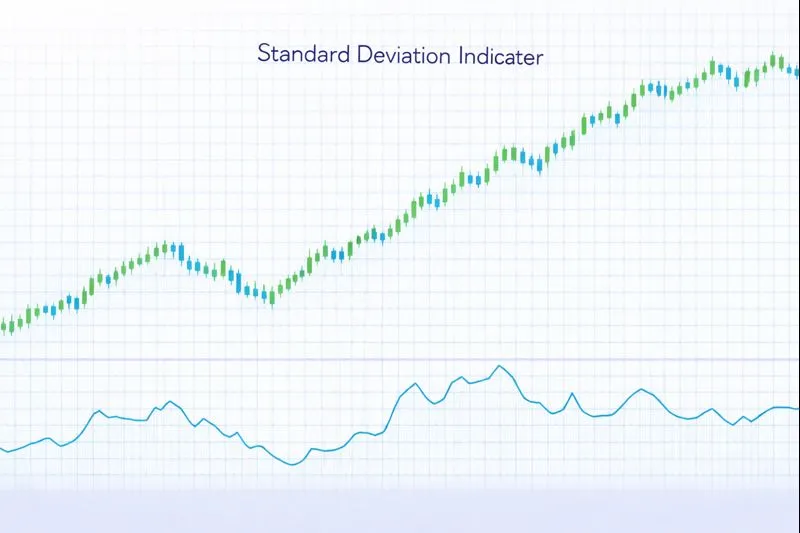
The Standard Deviation is a statistical volatility indicator that measures the dispersion of price values from their mean (average) over a specified period. Developed as a fundamental statistical concept and widely used in technical analysis, Standard Deviation quantifies how much prices deviate from the average price, providing a measure of market volatility and price dispersion. Higher Standard Deviation values indicate greater price volatility (prices are more spread out from the mean), while lower values indicate lower volatility (prices are closer to the mean). Standard Deviation is commonly used as the basis for Bollinger Bands and other volatility-based indicators.
How Standard Deviation Works: Standard Deviation is calculated by first computing the mean (average) of closing prices over a specified period (typically 20 periods), then calculating the squared differences between each price and the mean, averaging these squared differences, and taking the square root. The formula is: Mean = Σ(Close) / n, Variance = Σ(Close - Mean)² / n, and Standard Deviation = √Variance, where n is the period. This statistical measure provides a numerical representation of price volatility: values near zero indicate low volatility (prices are close to the mean), while higher values indicate high volatility (prices are spread out from the mean). Standard Deviation is often displayed as an oscillator or as bands around a moving average.
When to Use Standard Deviation:
- Volatility Assessment: Standard Deviation is highly effective at identifying periods of high and low volatility. Rising Standard Deviation indicates increasing volatility and potential market instability, while falling Standard Deviation indicates decreasing volatility and potential market consolidation.
- Risk Management: Standard Deviation can be used to adjust position sizes and stop-loss levels based on current volatility. Higher volatility requires wider stops and smaller position sizes, while lower volatility allows tighter stops and larger position sizes.
- Breakout and Reversal Identification: Low Standard Deviation periods (volatility contraction) often precede significant breakouts or reversals, as periods of low volatility are typically followed by periods of high volatility. Rising Standard Deviation during a breakout confirms strong price movement.
Advantages:
- Provides a clear, objective measure of price volatility through statistical analysis, making it easy to compare volatility across different assets and timeframes. The mathematical calculation ensures reliability.
- Works effectively across multiple timeframes and asset classes, including stocks, forex, commodities, and cryptocurrencies. The statistical nature makes it universally applicable.
- Helps identify volatility cycles and anticipate market movements, as low volatility periods often precede high volatility periods. The statistical measurement improves reliability.
Limitations:
- Standard Deviation does not indicate price direction or trend strength, only the magnitude of price dispersion around the mean. Traders must combine it with directional indicators for entry and exit signals.
- The indicator may lag behind rapid volatility changes, as it relies on historical price data. The calculation uses a moving average of squared differences, which can delay response to sudden volatility spikes.
- Standard Deviation alone does not provide specific entry or exit signals, only volatility measurement. Traders should use it in combination with other indicators for comprehensive analysis.
In summary, Standard Deviation is a valuable volatility indicator that provides statistical measurement of price dispersion, making it ideal for risk management, volatility assessment, and identifying periods of market consolidation and expansion. For comprehensive understanding, refer to statistical analysis literature on volatility measurement, Investopedia's Standard Deviation guide, TradingView's Standard Deviation documentation, and academic research on statistical volatility measurement in financial markets published in journals such as the Journal of Financial Markets and Quantitative Finance journals.
Practical Example: Using the Standard Deviation Indicator in a Trading Strategy
The Standard Deviation is a volatility indicator used to measure price dispersion and assess market volatility through statistical analysis. In a trading strategy, the Standard Deviation indicator helps traders adjust risk management and identify periods of volatility contraction and expansion.
Scenario: You're creating a breakout strategy for EUR/USD on a 4-hour chart. You want to enter trades when volatility expands (Standard Deviation increases) after a period of low volatility (volatility squeeze), assuming that low volatility periods often precede significant price movements.
Strategy Logic:
- Calculate the Standard Deviation(20) using a 20-period calculation of closing prices. Standard Deviation measures price dispersion around the mean, with low values indicating low volatility and high values indicating high volatility.
- Buy signal: When Standard Deviation crosses above a threshold (e.g., 1.5 times the average Standard Deviation) after a period of low volatility (volatility expansion), indicating potential breakout with increasing volatility.
- Sell signal: When Standard Deviation falls below a threshold or when price reaches a target, indicating volatility normalization or trade completion.
Backtrader Example:
import backtrader as bt
import numpy as np

class StandardDeviationBreakoutStrategy(bt.Strategy):
    params = dict(
        std_period=20,
        std_threshold_multiplier=1.5,
        avg_std_period=20
    )

    def __init__(self):
        # Calculate Standard Deviation
        self.sma = bt.ind.SMA(self.data.close, period=self.p.std_period)
        # Standard Deviation calculation (simplified)
        # In practice, use bt.ind.StdDev or calculate manually
        self.std_dev = bt.ind.StdDev(self.data.close, period=self.p.std_period)
        self.avg_std = bt.ind.SMA(self.std_dev, period=self.p.avg_std_period)
        self.threshold = self.avg_std * self.p.std_threshold_multiplier

    def next(self):
        if not self.position:
            # Buy when Standard Deviation expands above threshold
            if self.std_dev[0] > self.threshold[0] and self.std_dev[-1] <= self.threshold[-1]:
                self.buy()
        else:
            # Sell when Standard Deviation contracts or target reached
            if self.std_dev[0] < self.threshold[0] or self._target_reached():
                self.sell()

    def _target_reached(self):
        # Add target logic
        return False

# Usage
cerebro = bt.Cerebro()
cerebro.addstrategy(StandardDeviationBreakoutStrategy)
Expected Outcome: By using the Standard Deviation indicator, your strategy identifies volatility expansion periods that often precede significant price movements, helping you enter trades when volatility increases after consolidation. This approach leads to better breakout identification, improved risk management, and enhanced entry timing by trading volatility cycles.
💡 Bonus Tip
Consider using Standard Deviation in combination with Bollinger Bands, which are based on Standard Deviation. When Bollinger Bands contract (low Standard Deviation), it often precedes a breakout. When bands expand (high Standard Deviation) after a squeeze, it confirms strong price movement. This technique, documented in technical analysis literature, can significantly improve the accuracy of Standard Deviation-based trading strategies.
Using the Standard Deviation indicator ensures your strategy adapts to volatility cycles, improving entry and exit timing based on statistical volatility measurement.