Chaikin Money Flow Indicator Explanation
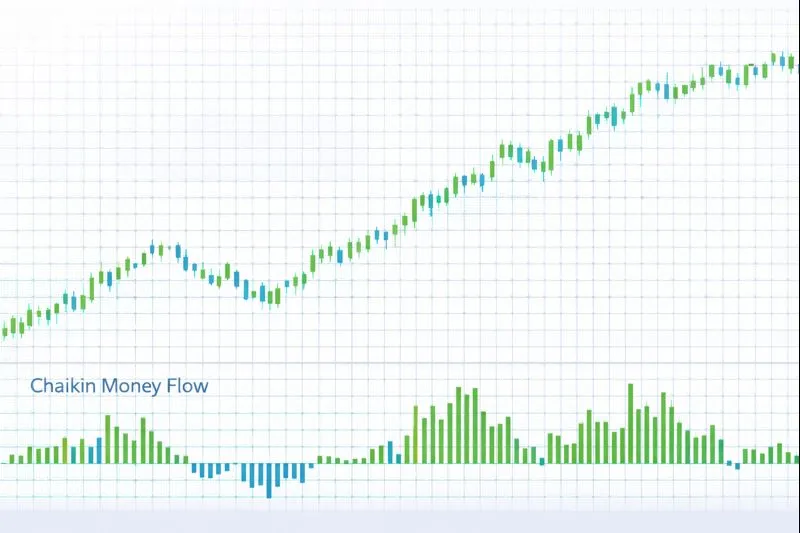
The Chaikin Money Flow (CMF) is a volume-weighted momentum oscillator that measures buying and selling pressure over a specified period by comparing the sum of volume-weighted price changes. Developed by Marc Chaikin in the 1980s, CMF is similar to the Accumulation Distribution Line but normalized to oscillate between -1 and +1, making it easier to interpret and compare across different assets. CMF uses the Money Flow Multiplier (MFM) to weight volume based on where the closing price falls within the day's trading range, then sums these weighted volumes over a specified period (typically 20 periods) and divides by total volume. Positive CMF values indicate buying pressure (accumulation), while negative values indicate selling pressure (distribution).
How Chaikin Money Flow Works: CMF is calculated using the Money Flow Multiplier (MFM) and Money Flow Volume (MFV) over a specified period. The formula is: Money Flow Multiplier = ((Close - Low) - (High - Close)) / (High - Low), Money Flow Volume = MFM × Volume, and CMF = Σ(MFV) / Σ(Volume) over the specified period (typically 20 periods). The MFM ranges from -1 to +1, with +1 indicating that the close is at the high (strong accumulation), -1 indicating that the close is at the low (strong distribution), and 0 indicating that the close is at the midpoint. CMF values above +0.25 typically indicate strong buying pressure, while values below -0.25 typically indicate strong selling pressure. The normalized format makes CMF easy to interpret and compare across different assets.
When to Use Chaikin Money Flow:
- Buying and Selling Pressure Identification: CMF is highly effective at identifying buying and selling pressure through volume-weighted analysis. Positive CMF values (above +0.25) indicate strong buying pressure, while negative CMF values (below -0.25) indicate strong selling pressure. The normalized format makes it easy to compare pressure levels across different assets.
- Overbought/Oversold Identification: CMF can identify overbought and oversold conditions. Values above +0.25 indicate overbought conditions (strong buying pressure that may be exhausted), while values below -0.25 indicate oversold conditions (strong selling pressure that may be exhausted). However, CMF can remain in extreme territory during strong trends.
- Divergence Analysis: CMF divergence occurs when price makes new highs or lows while CMF fails to confirm, often signaling potential trend reversals. Bullish divergence (price makes lower low, CMF makes higher low) suggests upward pressure building, while bearish divergence (price makes higher high, CMF makes lower high) suggests downward pressure building.
Advantages:
- Provides normalized measurement of buying and selling pressure that is easy to interpret and compare across different assets. The -1 to +1 range makes it more intuitive than cumulative indicators like A/D.
- Works effectively across multiple timeframes and asset classes, including stocks, forex, commodities, and cryptocurrencies, as volume flow analysis is universal. The normalized format ensures consistent interpretation.
- Helps identify volume divergences and anticipate potential reversals, as volume momentum often precedes price momentum changes. The normalized calculation improves reliability.
Limitations:
- CMF requires reliable volume data, which may not be available or accurate in all markets, particularly in forex markets where volume data can be less reliable. The indicator's effectiveness depends on the quality of volume information.
- The indicator may produce false signals in ranging markets when CMF oscillates around zero without clear directional bias. CMF works best in trending markets where buying and selling pressure is more clearly defined.
- CMF alone does not provide specific entry or exit signals, only buying and selling pressure measurement. Traders should use it in combination with price action and other indicators for comprehensive analysis.
In summary, Chaikin Money Flow is a valuable volume indicator that provides normalized measurement of buying and selling pressure, making it ideal for identifying accumulation and distribution phases, confirming trend strength, and anticipating potential price reversals. For comprehensive understanding, refer to Chaikin's original work on Chaikin Money Flow, Investopedia's CMF guide, TradingView's CMF documentation, and academic research on volume-price relationships in financial markets published in journals such as the Journal of Finance and the Review of Financial Studies.
Practical Example: Using the Chaikin Money Flow Indicator in a Trading Strategy
The Chaikin Money Flow (CMF) is a volume-weighted momentum oscillator used to identify buying and selling pressure through normalized volume flow analysis. In a trading strategy, the CMF indicator helps traders make entry and exit decisions based on accumulation and distribution phases.
Scenario: You're creating a mean-reversion strategy for EUR/USD on a 4-hour chart. You want to buy when CMF is below -0.25 (indicating oversold condition with strong selling pressure), and sell when CMF is above +0.25 (indicating overbought condition with strong buying pressure), assuming prices will revert to the mean.
Strategy Logic:
- Calculate the CMF(20) using a 20-period calculation. CMF oscillates between -1 and +1, with values above +0.25 indicating strong buying pressure and values below -0.25 indicating strong selling pressure.
- Buy signal: When CMF crosses above -0.25 after being below it (oversold condition reversal), indicating potential upward momentum with buying pressure increasing.
- Sell signal: When CMF crosses below +0.25 after being above it (overbought condition reversal), indicating potential downward momentum with selling pressure increasing.
Backtrader Example:
import backtrader as bt

class CMFMeanReversionStrategy(bt.Strategy):
    params = dict(
        cmf_period=20,
        oversold_level=-0.25,
        overbought_level=0.25
    )

    def __init__(self):
        # Calculate CMF: Σ(MFV) / Σ(Volume)
        # MFM = ((Close - Low) - (High - Close)) / (High - Low)
        price_range = self.data.high - self.data.low
        mfm = ((self.data.close - self.data.low) - (self.data.high - self.data.close)) / bt.ind.If(price_range > 0, price_range, 1.0)
        mfv = mfm * self.data.volume
        # Sum over period and divide by total volume
        mfv_sum = bt.ind.Sum(mfv, period=self.p.cmf_period)
        volume_sum = bt.ind.Sum(self.data.volume, period=self.p.cmf_period)
        self.cmf = mfv_sum / bt.ind.If(volume_sum > 0, volume_sum, 1.0)

    def next(self):
        if not self.position:
            # Buy when CMF crosses above oversold level
            if (self.cmf[0] > self.p.oversold_level and
                self.cmf[-1] <= self.p.oversold_level):
                self.buy()
        else:
            # Sell when CMF crosses below overbought level
            if (self.cmf[0] < self.p.overbought_level and
                self.cmf[-1] >= self.p.overbought_level):
                self.sell()

# Usage
cerebro = bt.Cerebro()
cerebro.addstrategy(CMFMeanReversionStrategy)
Expected Outcome: By using the CMF indicator, your strategy identifies buying and selling pressure extremes, helping you enter trades when prices are likely to revert to the mean after reaching extreme pressure levels. This approach leads to better mean-reversion entries, improved pressure identification, and enhanced risk-reward ratios in ranging markets where pressure extremes often precede price reversals.
💡 Bonus Tip
Consider using CMF in combination with price action analysis for confirmation. When CMF is below -0.25 and price makes a new low with a bullish candlestick pattern (e.g., hammer, engulfing), it suggests strong oversold condition with potential bullish reversal. This technique, documented in Chaikin's original methodology, can significantly improve the accuracy of CMF-based trading strategies.
Using the CMF indicator ensures your strategy captures buying and selling pressure effectively, improving entry and exit timing based on normalized volume flow analysis.