CCI (Commodity Channel Index) Indicator Explanation
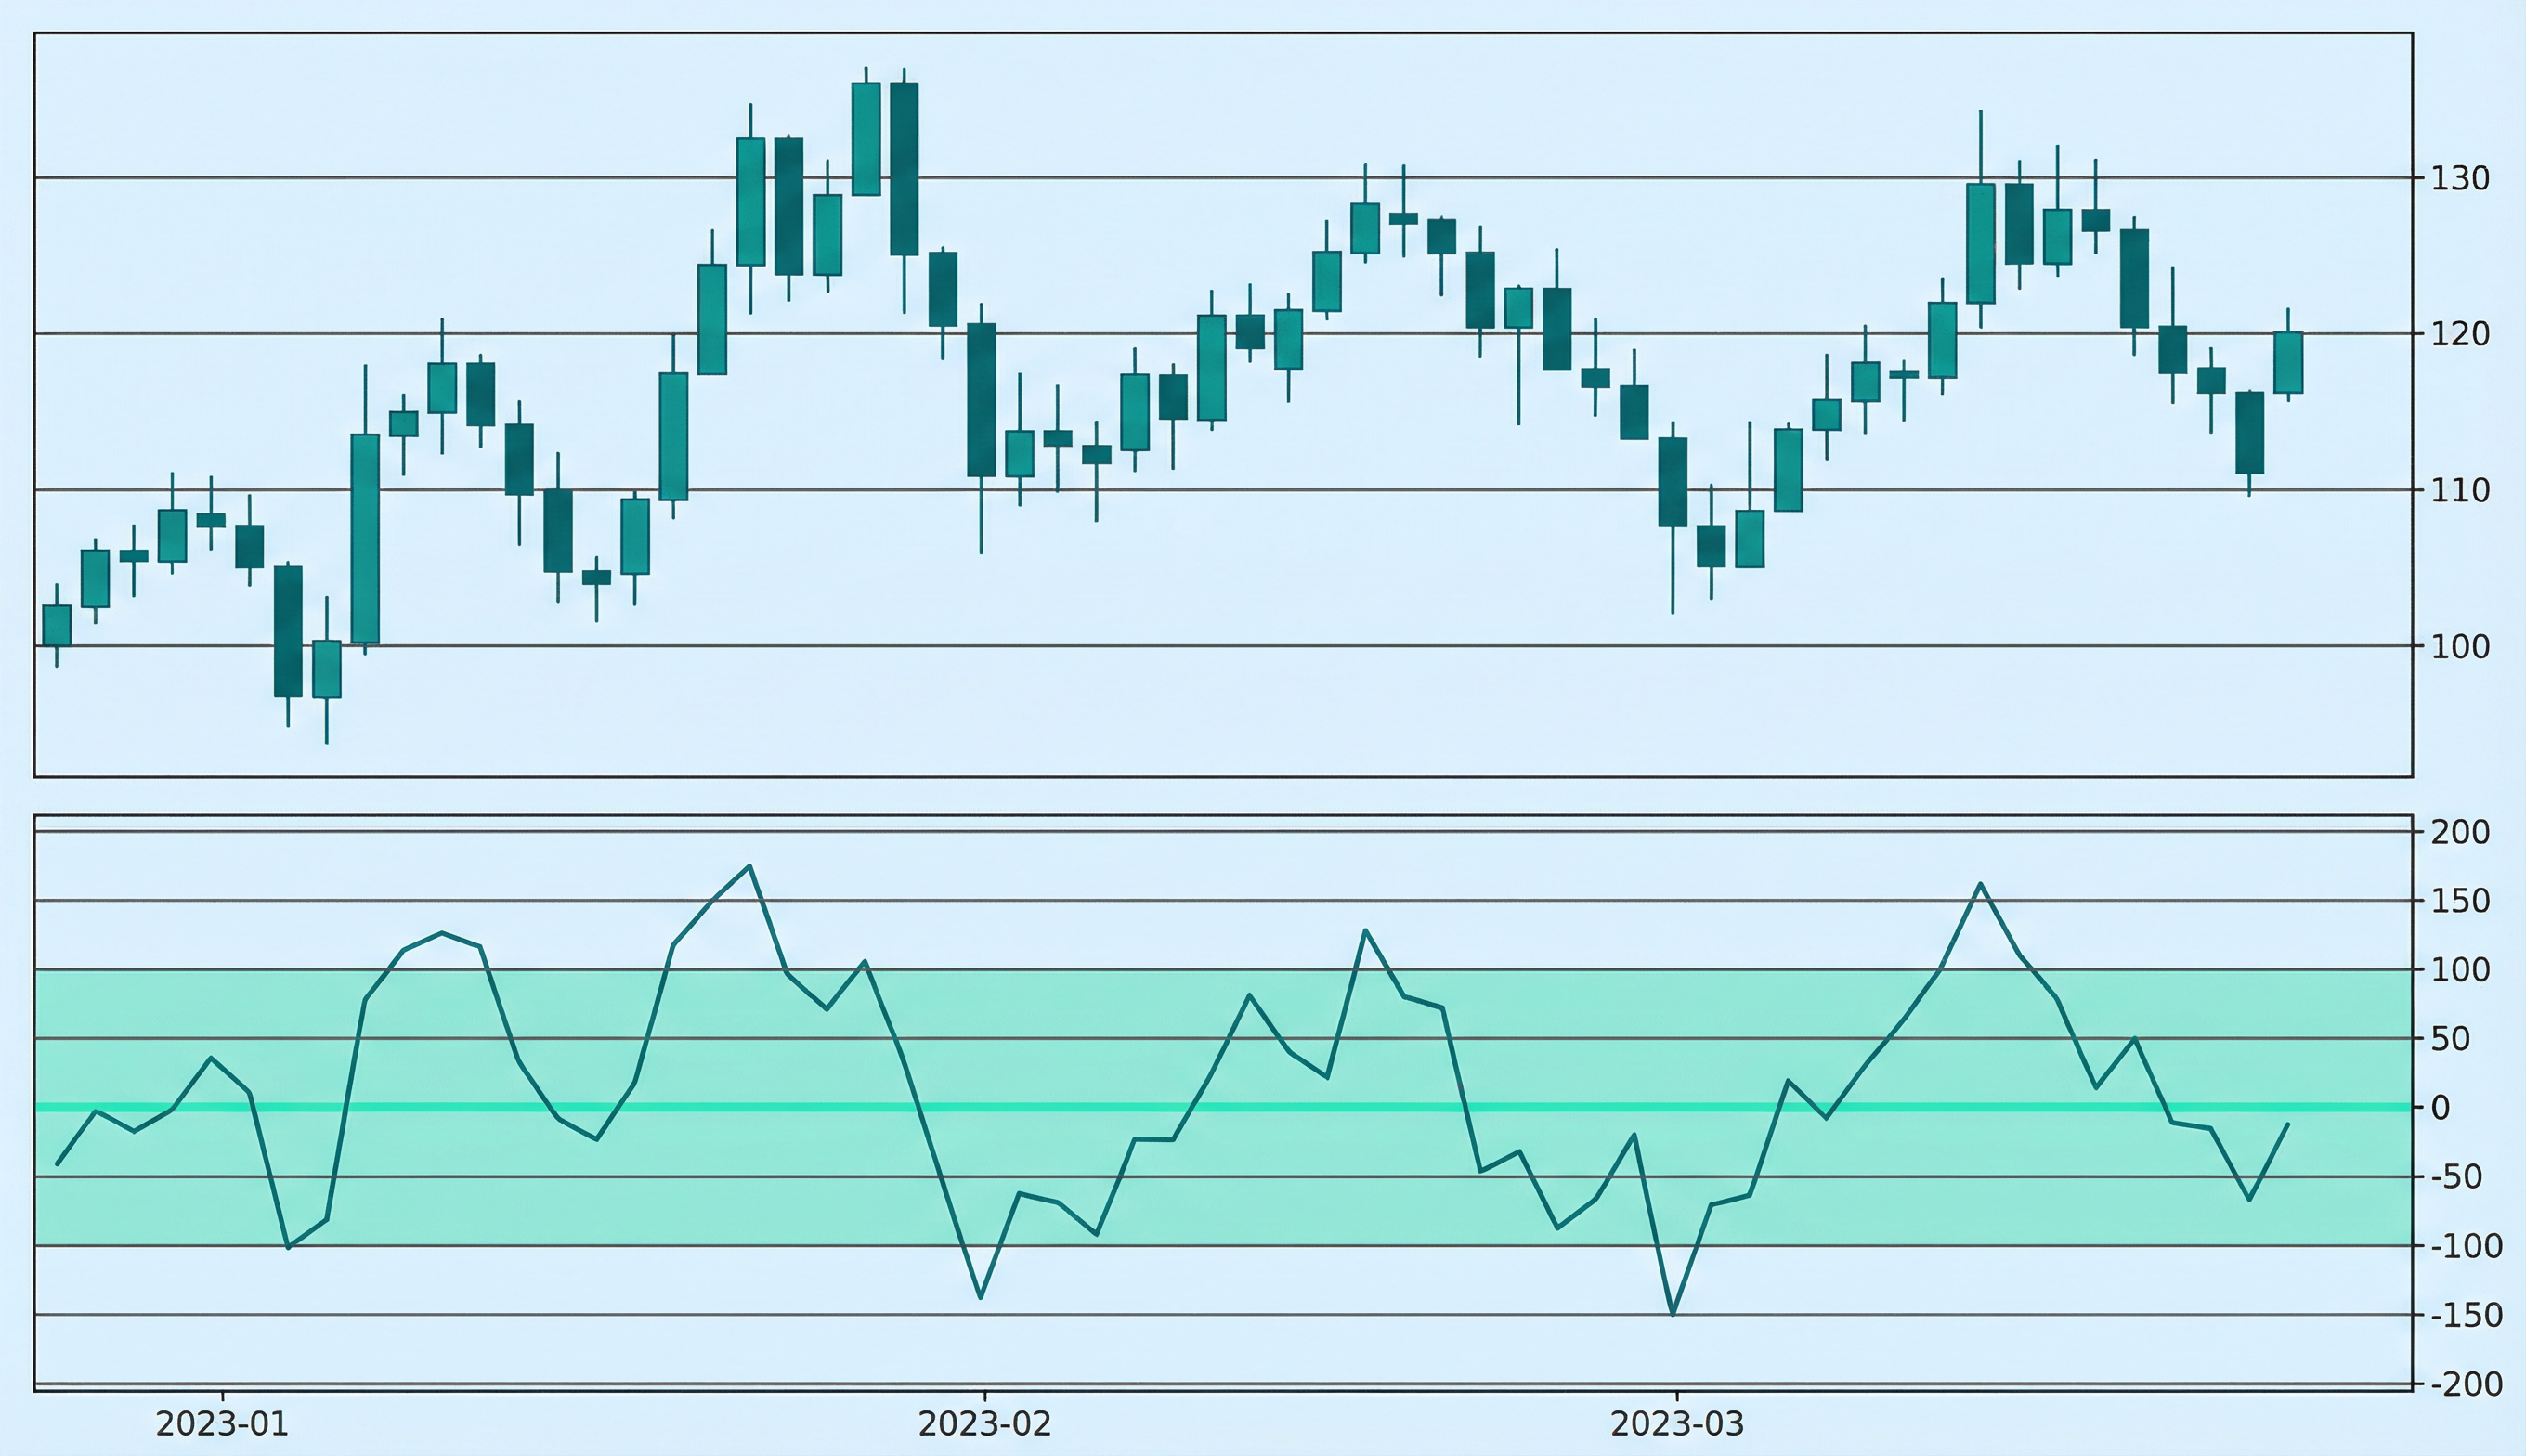
The Commodity Channel Index (CCI) is a momentum oscillator that measures the deviation of price from its statistical mean to identify cyclical trends and overbought/oversold conditions. Developed by Donald Lambert in 1980 and introduced in his article "Commodity Channel Index: Tool for Trading Cyclical Trends" published in Commodities magazine, CCI oscillates around a zero line, typically ranging from -100 to +100, though it can extend beyond these levels. The indicator is designed to identify cyclical trends in commodities but has proven effective across all asset classes, providing traders with insights into momentum, trend strength, and potential reversal points.
How CCI Works: CCI is calculated using the formula: CCI = (Typical Price - SMA of Typical Price) / (0.015 × Mean Deviation), where Typical Price is the average of high, low, and close prices [(High + Low + Close) / 3], and Mean Deviation is the mean of the absolute differences between Typical Price and its moving average over the lookback period (typically 20 periods). The constant 0.015 ensures that approximately 70-80% of CCI values fall within the -100 to +100 range. Values above +100 typically indicate overbought conditions and strong upward momentum, while values below -100 typically indicate oversold conditions and strong downward momentum. The indicator's ability to extend beyond these levels makes it particularly useful for identifying extreme market conditions.
When to Use CCI:
- Cyclical Trend Identification: CCI is highly effective at identifying cyclical trends and momentum shifts, particularly in commodities and other cyclical markets. The indicator helps traders identify when prices are deviating significantly from their statistical mean, signaling potential trend changes or reversals.
- Overbought/Oversold Identification: CCI provides clear signals for overbought conditions (values above +100) and oversold conditions (values below -100), helping traders identify potential reversal points when prices reach extreme levels relative to their statistical mean.
- Momentum Confirmation: The indicator helps confirm momentum strength and direction. Values consistently above +100 indicate strong upward momentum, while values consistently below -100 indicate strong downward momentum. The indicator's ability to extend beyond these levels helps identify extreme market conditions.
Advantages:
- Provides clear, objective signals for overbought and oversold conditions with well-defined thresholds (+100 for overbought, -100 for oversold), making it easy to identify potential entry and exit points without subjective interpretation. The statistical basis of the indicator enhances its reliability.
- Works effectively across multiple timeframes and asset classes, including stocks, forex, commodities, and cryptocurrencies, as momentum and cyclical trend measurement is universal. The indicator is particularly useful in trending markets where prices move in cycles.
- Helps identify extreme market conditions that may not be apparent with other indicators, as CCI can extend beyond the typical -100 to +100 range, providing additional insights into market momentum and potential reversals.
Limitations:
- CCI can remain in overbought or oversold territory for extended periods during strong trends, leading to premature exit signals if used in isolation without trend confirmation. The indicator may give false signals in ranging markets where prices oscillate without clear directional movement.
- False signals can occur when CCI oscillates around the zero line without clear directional bias, requiring additional confirmation from other indicators or price action analysis. The indicator's sensitivity to price deviations can result in frequent signals during volatile periods.
- The default 20-period setting may not be optimal for all markets and timeframes, requiring parameter optimization based on market characteristics and trading style. Shorter periods increase sensitivity but may produce more false signals, while longer periods reduce sensitivity but may miss trading opportunities.
In summary, CCI is a valuable momentum indicator for traders seeking to identify cyclical trends, overbought and oversold conditions, and potential reversal points across various asset classes. For comprehensive understanding, refer to Lambert's original work "Commodity Channel Index: Tool for Trading Cyclical Trends" (1980), Investopedia's CCI guide, TradingView's CCI documentation, and academic research on momentum oscillators in technical analysis published in journals such as the Journal of Financial Markets and the Review of Financial Studies.
Practical Example: Using the CCI Indicator in a Trading Strategy
The Commodity Channel Index (CCI) is a momentum oscillator used to identify cyclical trends and overbought/oversold conditions by measuring the deviation of price from its statistical mean. In a trading strategy, the CCI indicator helps traders make entry and exit decisions based on momentum extremes and potential reversal signals.
Scenario: You're creating a trend-following strategy for Crude Oil (WTI/USD) on a 4-hour chart. You want to buy when CCI indicates strong upward momentum (CCI above +100) and sell when it indicates strong downward momentum (CCI below -100), assuming the cyclical trend will continue in the direction of the momentum.
Strategy Logic:
- Calculate the CCI(20) to measure current momentum conditions relative to the statistical mean. The indicator oscillates around zero, where values above +100 indicate overbought conditions and strong upward momentum, while values below -100 indicate oversold conditions and strong downward momentum.
- Buy signal: When CCI crosses above +100 (strong upward momentum) and remains above this level, indicating potential trend continuation and entry opportunity.
- Sell signal: When CCI crosses below -100 (strong downward momentum) and remains below this level, indicating potential trend reversal and exit opportunity.
Backtrader Example:
import backtrader as bt

class CCITrendStrategy(bt.Strategy):
    params = dict(
        cci_period=20,
        overbought_level=100,
        oversold_level=-100
    )

    def __init__(self):
        self.cci = bt.ind.CCI(period=self.p.cci_period)

    def next(self):
        if not self.position:
            # Buy when CCI crosses above +100 (strong upward momentum)
            if (self.cci[0] > self.p.overbought_level and
                self.cci[-1] <= self.p.overbought_level):
                self.buy()
        else:
            # Sell when CCI crosses below -100 (strong downward momentum)
            if (self.cci[0] < self.p.oversold_level and
                self.cci[-1] >= self.p.oversold_level):
                self.sell()

# Usage
cerebro = bt.Cerebro()
cerebro.addstrategy(CCITrendStrategy)
Expected Outcome: By using the CCI indicator, your strategy identifies cyclical trends and momentum extremes, helping you enter trades when momentum is strong and exit when momentum weakens or reverses. This approach leads to better trend-following entries, improved momentum confirmation, and enhanced risk management by avoiding trades during uncertain market conditions.
💡 Bonus Tip
Consider using CCI divergence as a confirmation signal. When price makes a new high but CCI makes a lower high, it suggests weakening upward momentum and potential bearish reversal. This technique, documented in Lambert's original methodology, can significantly improve the accuracy of CCI-based trading strategies by identifying trend exhaustion before price reversals occur.
Using the CCI indicator ensures your strategy captures cyclical trends and momentum shifts effectively, improving entry and exit timing based on objective momentum measurements relative to the statistical mean.