RSI (Relative Strength Index) Indicator Explanation
The Relative Strength Index (RSI) is a momentum oscillator that measures the speed and magnitude of price changes to identify overbought and oversold conditions in financial markets. Developed by J. Welles Wilder Jr. in 1978 and introduced in his book "New Concepts in Technical Trading Systems," RSI oscillates between 0 and 100, providing traders with a normalized view of price momentum that helps identify potential reversal points and trend strength.
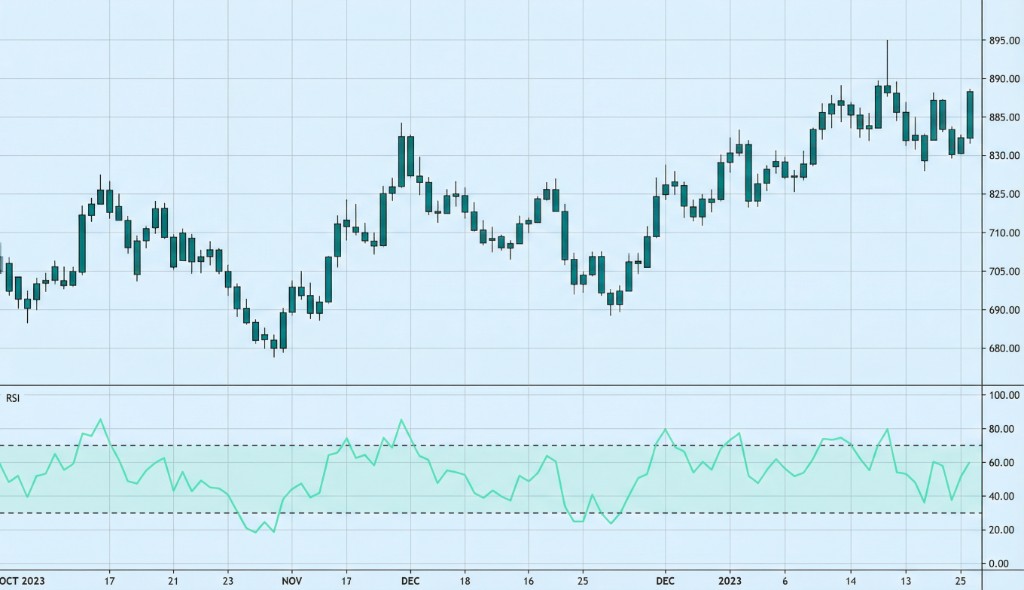
How RSI Works: RSI is calculated using a two-step process. First, the average gain and average loss over a specified period (typically 14 periods) are computed. The Relative Strength (RS) is then calculated as the ratio of average gain to average loss. Finally, RSI is derived using the formula: RSI = 100 - (100 / (1 + RS)). This mathematical approach normalizes the indicator to a 0-100 scale, where values above 70 typically indicate overbought conditions and values below 30 indicate oversold conditions. The indicator uses exponential smoothing to reduce noise and provide smoother signals.
When to Use RSI:
- Overbought/Oversold Identification: RSI helps identify when an asset is potentially overbought (RSI > 70) or oversold (RSI < 30), signaling potential reversal opportunities in ranging markets.
- Divergence Analysis: RSI divergence occurs when price makes new highs or lows while RSI fails to confirm, often indicating weakening momentum and potential trend reversals.
- Trend Confirmation: In trending markets, RSI can confirm trend strength when it remains in overbought territory during uptrends or oversold territory during downtrends, indicating strong momentum continuation.
Advantages:
- Provides clear, objective signals for overbought and oversold conditions, making it easy to identify potential entry and exit points without subjective interpretation.
- Works across multiple timeframes and asset classes, including stocks, forex, commodities, and cryptocurrencies, as momentum measurement is universal.
- Helps reduce false signals when combined with trend indicators, as RSI divergence and overbought/oversold conditions are more reliable when confirmed by price action and trend direction.
Limitations:
- RSI can remain in overbought or oversold territory for extended periods during strong trends, leading to premature exit signals if used in isolation without trend confirmation.
- False signals can occur in ranging markets when RSI oscillates between 30 and 70 without clear directional bias, requiring additional confirmation from other indicators.
- The default 14-period setting may not be optimal for all markets and timeframes, requiring parameter optimization based on market characteristics and trading style.
In summary, RSI is a fundamental momentum indicator for traders seeking to identify overbought and oversold conditions and potential reversal points. For comprehensive understanding, refer to Wilder's original work "New Concepts in Technical Trading Systems" (1978), Investopedia's RSI guide, TradingView's RSI documentation, and academic research on momentum oscillators in technical analysis published in journals such as the Journal of Financial Markets and the Review of Financial Studies.
Practical Example: Using the RSI Indicator in a Trading Strategy
The Relative Strength Index (RSI) is a momentum oscillator used to identify overbought and oversold conditions in trading markets. In a trading strategy, the RSI indicator helps traders make entry and exit decisions based on momentum extremes and potential reversal signals.
Scenario: You're creating a mean-reversion strategy for EUR/USD on a 4-hour chart. You want to buy when the currency pair is oversold (RSI below 30) and sell when it's overbought (RSI above 70), assuming prices will revert to the mean after reaching extreme momentum levels.
Strategy Logic:
- Calculate the RSI(14) to measure current momentum conditions.
- Buy signal: When RSI crosses below 30 (oversold condition) and then crosses back above 30, indicating potential upward momentum reversal.
- Sell signal: When RSI crosses above 70 (overbought condition) and then crosses back below 70, indicating potential downward momentum reversal.
Backtrader Example:
import backtrader as bt

class RSIMeanReversionStrategy(bt.Strategy):
    params = dict(
        rsi_period=14,
        oversold_level=30,
        overbought_level=70
    )

    def __init__(self):
        self.rsi = bt.ind.RSI(period=self.p.rsi_period)

    def next(self):
        if not self.position:
            # Buy when RSI crosses back above oversold level (30)
            if self.rsi[0] > self.p.oversold_level and self.rsi[-1] <= self.p.oversold_level:
                self.buy()
        else:
            # Sell when RSI crosses back below overbought level (70)
            if self.rsi[0] < self.p.overbought_level and self.rsi[-1] >= self.p.overbought_level:
                self.sell()

# Usage
cerebro = bt.Cerebro()
cerebro.addstrategy(RSIMeanReversionStrategy)
Expected Outcome: By using the RSI indicator, your strategy identifies momentum extremes and potential reversal points, helping you enter trades when prices are likely to revert to the mean. This approach leads to better entry timing, reduced false breakout entries, and improved risk-reward ratios in ranging markets.
💡 Bonus Tip
Consider using RSI divergence as a confirmation signal. When price makes a new low but RSI makes a higher low, it suggests weakening downward momentum and potential bullish reversal. This technique, documented in technical analysis literature, can significantly improve the accuracy of RSI-based trading strategies.
Using the RSI indicator ensures your strategy captures momentum shifts effectively, improving entry and exit timing based on objective momentum measurements.