Momentum Indicator Explanation
The Momentum indicator is a technical analysis tool that measures the rate of change in price over a specified period to identify trend strength and potential reversal points. While the concept of momentum in trading dates back to early technical analysis literature, the momentum indicator as we know it today was popularized in the 1970s and 1980s through various technical analysis publications. The indicator calculates the difference between the current closing price and the closing price from a specified number of periods ago, providing traders with a direct measure of price velocity and trend acceleration or deceleration.
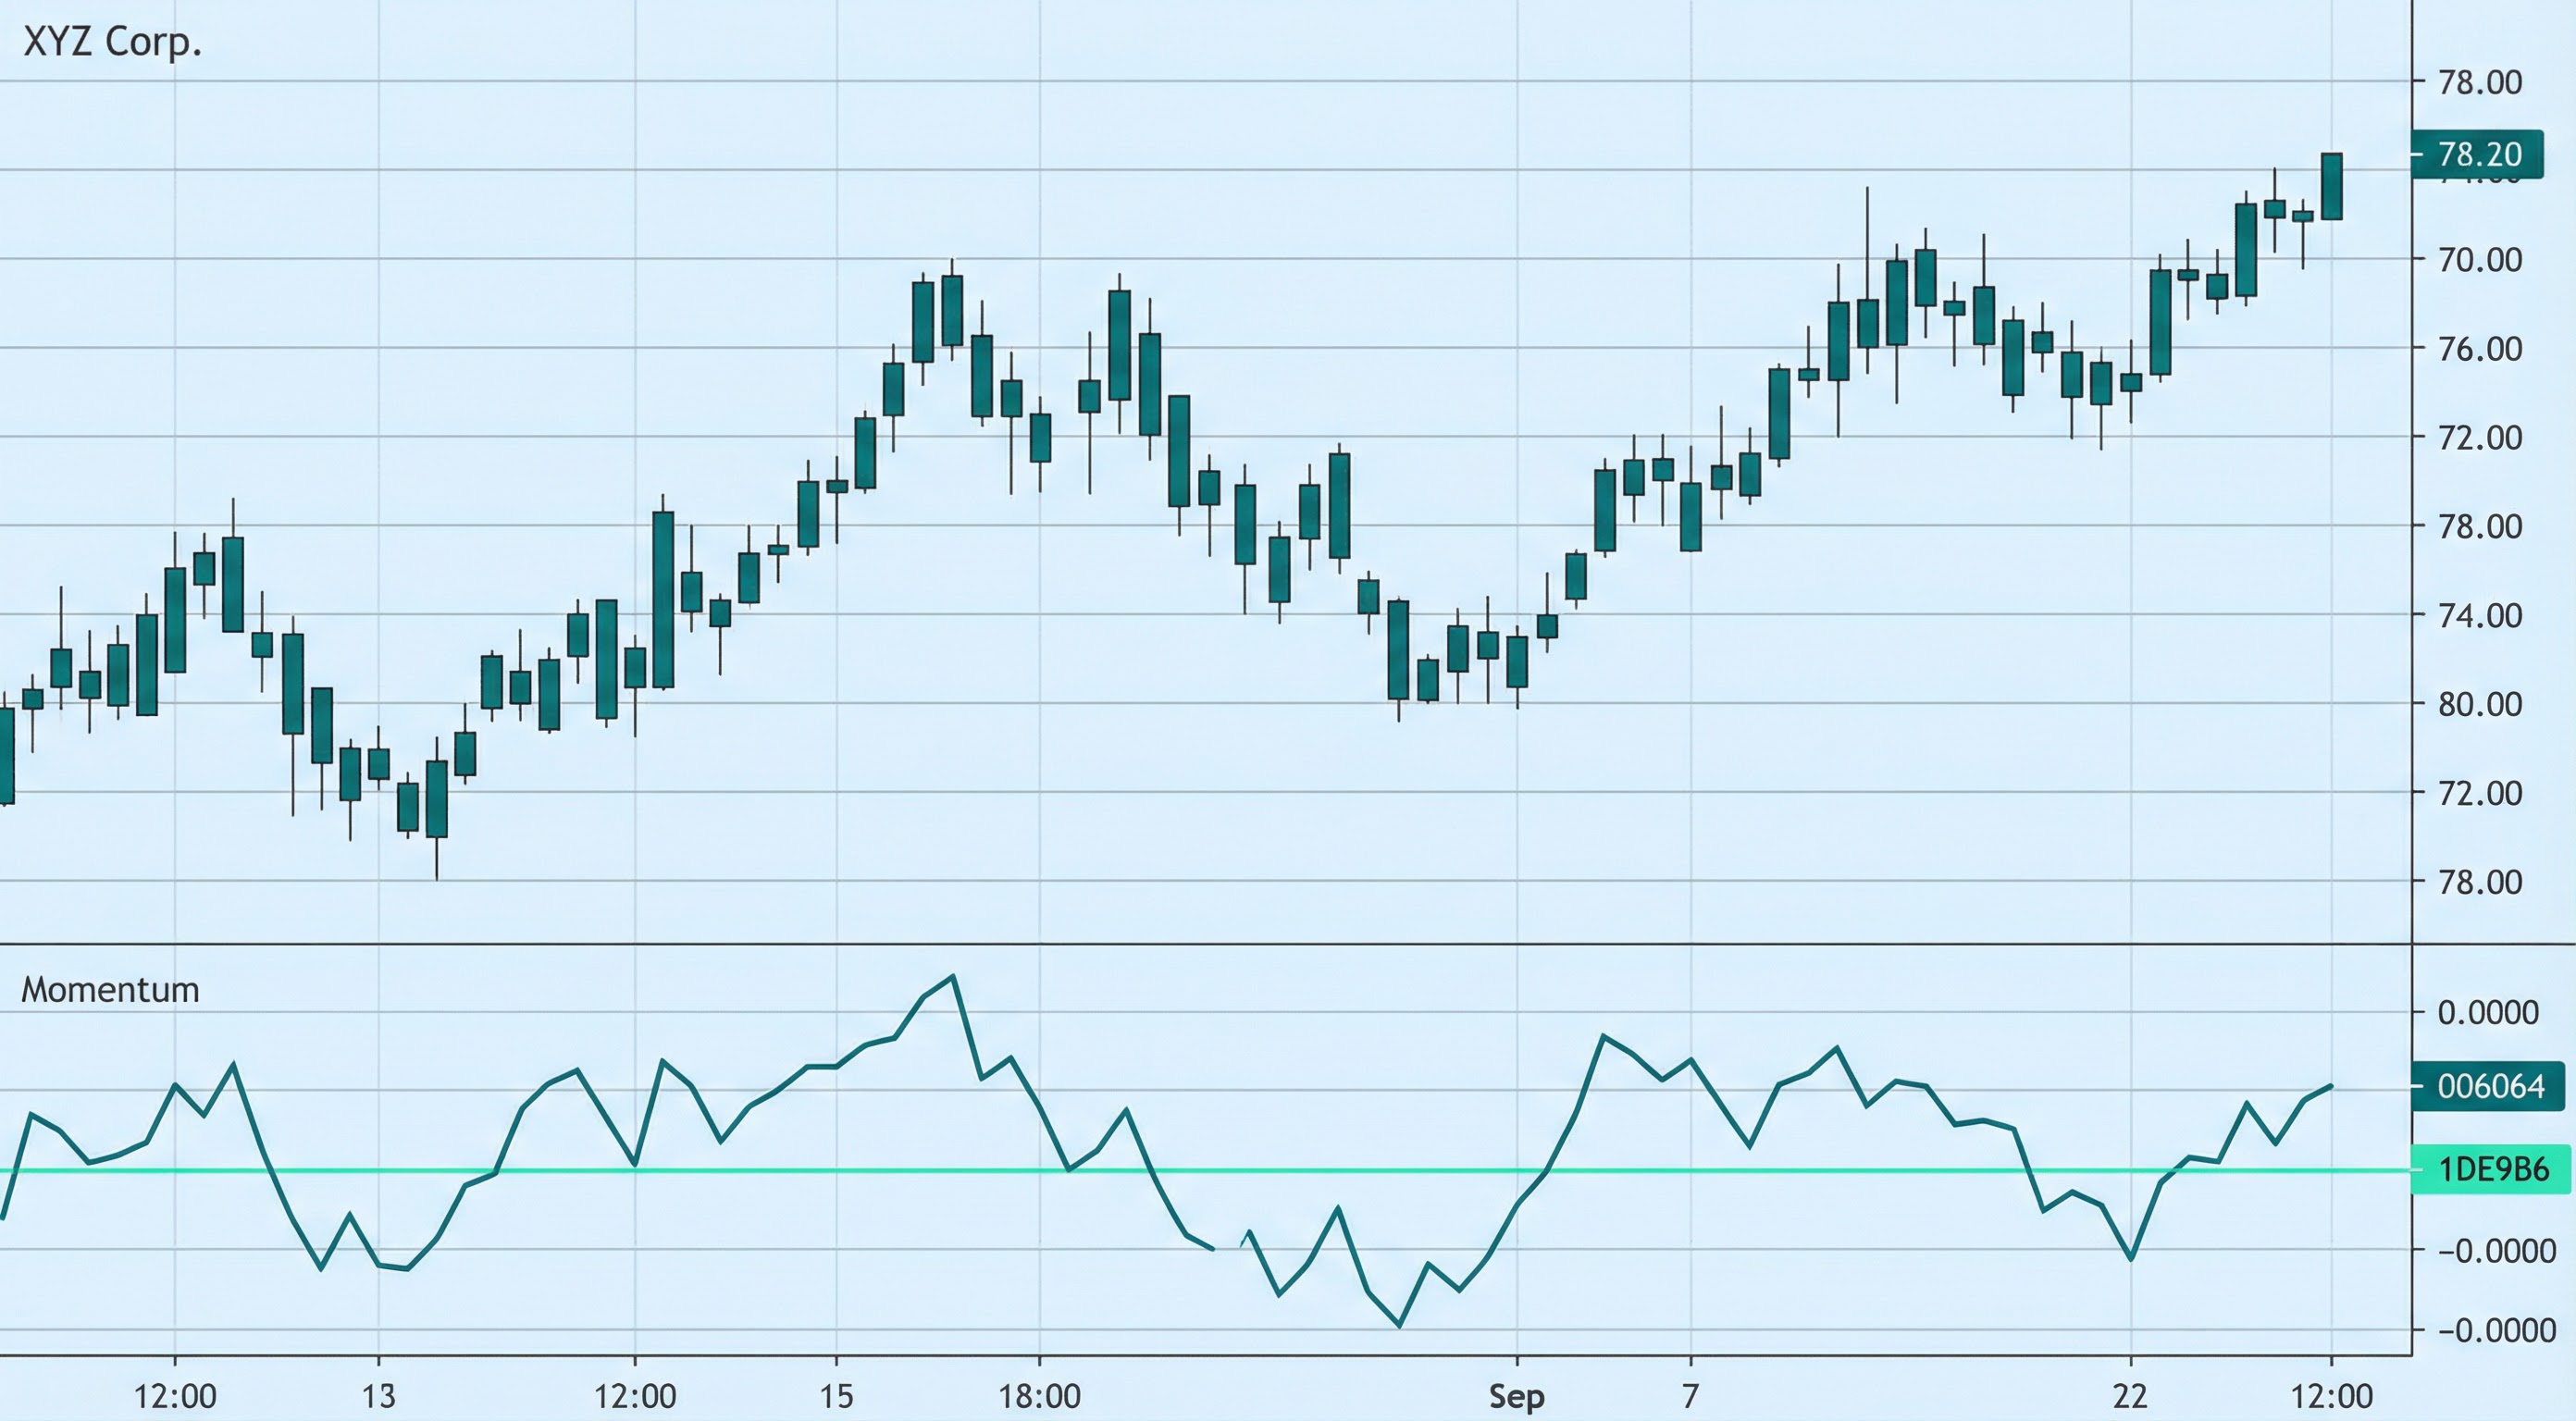
How Momentum Works: The Momentum indicator is calculated using a simple formula: Momentum = Current Close - Close N periods ago, where N is typically 10 or 14 periods. The result is a value that oscillates around a zero line, where positive values indicate upward momentum (current price is higher than price N periods ago) and negative values indicate downward momentum (current price is lower than price N periods ago). The magnitude of the momentum value indicates the strength of the price movement, with larger values suggesting stronger momentum. Some implementations normalize the indicator by dividing by the price N periods ago and multiplying by 100, creating a percentage-based momentum oscillator that ranges around 100.
When to Use Momentum:
- Trend Strength Measurement: Momentum is highly effective at measuring trend strength and identifying when trends are accelerating or decelerating. Rising momentum values in an uptrend indicate strengthening trend, while declining momentum values suggest weakening trend and potential reversal.
- Divergence Analysis: Momentum divergence occurs when price makes new highs or lows while Momentum fails to confirm, often signaling potential trend reversals. Bullish divergence (price makes lower low, Momentum makes higher low) suggests upward momentum building, while bearish divergence (price makes higher high, Momentum makes lower high) suggests downward momentum building.
- Zero Line Crossovers: Momentum crossing above zero indicates a shift from negative to positive momentum, potentially signaling the start of an uptrend. Conversely, Momentum crossing below zero indicates a shift from positive to negative momentum, potentially signaling the start of a downtrend.
Advantages:
- Provides a direct, intuitive measure of price velocity and trend strength, making it easy to understand and interpret. The simple calculation method ensures the indicator responds quickly to price changes without the smoothing effects of moving averages.
- Works effectively across multiple timeframes and asset classes, including stocks, forex, commodities, and cryptocurrencies, as momentum measurement is universal. The indicator is particularly useful for identifying trend acceleration and deceleration.
- Helps identify potential trend reversals through divergence analysis and zero line crossovers, providing clear signals for entry and exit points. The indicator's sensitivity to price changes makes it valuable for catching trend changes early.
Limitations:
- Momentum can produce false signals during ranging or sideways markets when price oscillates without clear directional movement, requiring confirmation from trend indicators or price action analysis. The indicator's sensitivity to price changes can result in frequent signals during volatile periods.
- The indicator may lag behind price movements during rapid market changes, as it compares current price to price from N periods ago. This lag can result in delayed signals, especially during strong trending markets.
- Momentum values can vary significantly across different assets and timeframes, making it difficult to set universal thresholds for overbought or oversold conditions. Traders should use the indicator in conjunction with other technical tools for more reliable signals.
In summary, Momentum is a valuable indicator for traders seeking to measure trend strength, identify potential reversals, and catch trend changes early. For comprehensive understanding, refer to technical analysis literature on momentum and rate of change indicators, Investopedia's Momentum guide, TradingView's Momentum documentation, and academic research on momentum indicators in technical analysis published in journals such as the Journal of Financial Markets and the Review of Financial Studies.
Practical Example: Using the Momentum Indicator in a Trading Strategy
The Momentum indicator is a technical tool used to measure the rate of price change over a specified period to identify trend strength and potential reversal points. In a trading strategy, the Momentum indicator helps traders make entry and exit decisions based on trend acceleration, deceleration, and momentum shifts.
Scenario: You're creating a trend-following strategy for Apple stock (AAPL) on a daily chart. You want to buy when Momentum indicates strong upward momentum (Momentum crossing above zero and rising) and sell when it indicates strong downward momentum (Momentum crossing below zero and falling), assuming the trend will continue in the direction of the momentum.
Strategy Logic:
- Calculate the Momentum(10) to measure the rate of price change over the past 10 periods. The indicator oscillates around zero, where positive values indicate upward momentum and negative values indicate downward momentum.
- Buy signal: When Momentum crosses above zero (shifting from negative to positive) and continues to rise, indicating strong upward momentum and potential trend continuation.
- Sell signal: When Momentum crosses below zero (shifting from positive to negative) and continues to fall, indicating strong downward momentum and potential trend reversal.
Backtrader Example:
import backtrader as bt

class MomentumTrendStrategy(bt.Strategy):
    params = dict(
        momentum_period=10
    )

    def __init__(self):
        self.momentum = bt.ind.Momentum(period=self.p.momentum_period)

    def next(self):
        if not self.position:
            # Buy when Momentum crosses above zero (positive momentum)
            if (self.momentum[0] > 0 and self.momentum[-1] <= 0):
                self.buy()
        else:
            # Sell when Momentum crosses below zero (negative momentum)
            if (self.momentum[0] < 0 and self.momentum[-1] >= 0):
                self.sell()

# Usage
cerebro = bt.Cerebro()
cerebro.addstrategy(MomentumTrendStrategy)
Expected Outcome: By using the Momentum indicator, your strategy identifies trend strength and momentum shifts, helping you enter trades when momentum is building and exit when momentum is weakening or reversing. This approach leads to better trend-following entries, improved momentum confirmation, and enhanced risk management by avoiding trades during uncertain market conditions.
💡 Bonus Tip
Consider using Momentum divergence as a confirmation signal. When price makes a new high but Momentum makes a lower high, it suggests weakening upward momentum and potential bearish reversal. This technique, documented in technical analysis literature, can significantly improve the accuracy of Momentum-based trading strategies by identifying trend exhaustion before price reversals occur.
Using the Momentum indicator ensures your strategy captures trend strength and momentum shifts effectively, improving entry and exit timing based on objective momentum measurements.