MACD (Moving Average Convergence Divergence) Indicator Explanation
The Moving Average Convergence Divergence (MACD) is one of the most popular momentum indicators in technical analysis, designed to identify changes in trend direction, momentum, and strength. Developed by Gerald Appel in the late 1970s and detailed in his book "Technical Analysis: Power Tools for Active Investors" (2005), MACD combines multiple exponential moving averages (EMAs) to generate trading signals and identify potential trend reversals. The indicator consists of three components: the MACD line, the signal line, and the histogram, each providing unique insights into market momentum and trend dynamics.
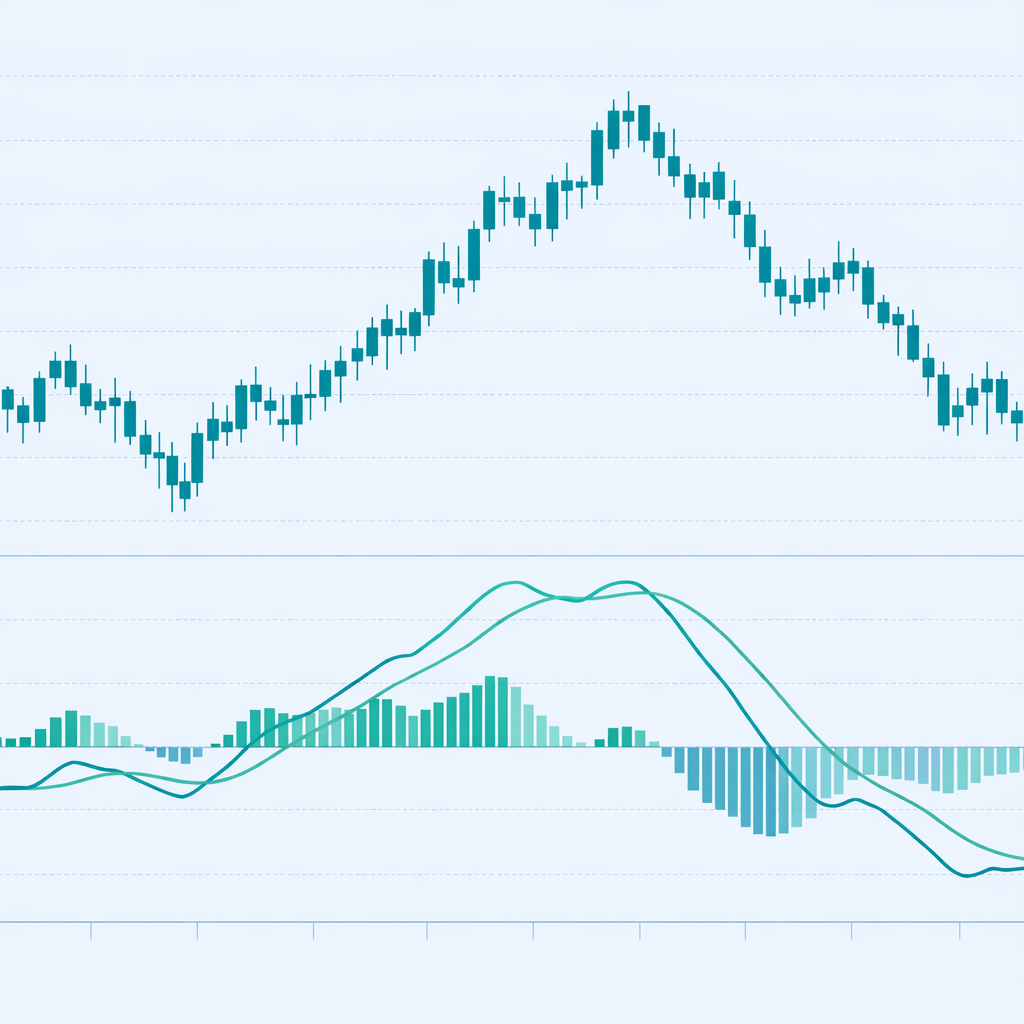
How MACD Works: MACD is calculated using three exponential moving averages. First, the MACD line is computed as the difference between a 12-period EMA and a 26-period EMA of closing prices: MACD Line = EMA(12) - EMA(26). The signal line is then calculated as a 9-period EMA of the MACD line itself, acting as a trigger for buy and sell signals. Finally, the histogram represents the difference between the MACD line and the signal line, visually displaying the momentum and strength of the trend. When the MACD line crosses above the signal line, it generates a bullish signal, and when it crosses below, it generates a bearish signal. The histogram's height and direction indicate the momentum's strength and potential trend continuation or reversal.
When to Use MACD:
- Trend Change Detection: MACD is highly effective at identifying trend reversals when the MACD line crosses the signal line, providing clear entry and exit signals in trending markets. The crossover signals are particularly reliable when confirmed by price action and volume analysis.
- Momentum Confirmation: The histogram component helps confirm trend strength and momentum. A growing histogram indicates strengthening momentum, while a shrinking histogram suggests weakening momentum and potential trend exhaustion.
- Divergence Analysis: MACD divergence occurs when price makes new highs or lows while MACD fails to confirm, often signaling potential trend reversals. Bullish divergence (price makes lower low, MACD makes higher low) suggests upward momentum, while bearish divergence (price makes higher high, MACD makes lower high) suggests downward momentum.
Advantages:
- Provides clear, objective signals through line crossovers and histogram analysis, making it easy to identify entry and exit points without subjective interpretation. The visual representation of momentum through the histogram enhances decision-making.
- Works effectively across multiple timeframes and asset classes, including stocks, forex, commodities, and cryptocurrencies, as momentum measurement is universal across markets.
- Combines trend-following and momentum characteristics, offering a comprehensive view of market dynamics that helps reduce false signals when used in conjunction with other technical indicators.
Limitations:
- MACD can produce false signals in ranging or sideways markets when crossovers occur frequently without clear directional movement, requiring confirmation from trend indicators or price action analysis.
- The indicator may lag behind price movements, especially during rapid market changes, as it relies on moving averages that smooth out price data. This lag can result in delayed entry and exit signals.
- MACD crossovers can occur late in strong trends, potentially missing significant portions of profitable moves. Traders should combine MACD with other indicators to improve timing and reduce the risk of late entries.
In summary, MACD is a versatile momentum indicator that provides valuable insights into trend direction, momentum strength, and potential reversal points. For comprehensive understanding, refer to Appel's original work "Technical Analysis: Power Tools for Active Investors" (2005), Investopedia's MACD guide, TradingView's MACD documentation, and academic research on momentum indicators in technical analysis published in journals such as the Journal of Financial Markets and the Review of Financial Studies.
Practical Example: Using the MACD Indicator in a Trading Strategy
The Moving Average Convergence Divergence (MACD) is a momentum indicator used to identify trend changes and momentum shifts through signal line crossovers and histogram analysis. In a trading strategy, the MACD indicator helps traders make entry and exit decisions based on momentum confirmation and trend direction changes.
Scenario: You're creating a trend-following strategy for Bitcoin (BTC/USDT) on a 4-hour chart. You want to buy when MACD indicates bullish momentum (MACD line crosses above signal line) and sell when it indicates bearish momentum (MACD line crosses below signal line), assuming the trend will continue in the direction of the crossover.
Strategy Logic:
- Calculate the MACD(12, 26, 9) to measure momentum and trend direction. The MACD line represents the difference between 12-period and 26-period EMAs, while the signal line is a 9-period EMA of the MACD line.
- Buy signal: When the MACD line crosses above the signal line (bullish crossover) and the histogram is positive, indicating upward momentum and potential trend continuation.
- Sell signal: When the MACD line crosses below the signal line (bearish crossover) and the histogram is negative, indicating downward momentum and potential trend reversal.
Backtrader Example:
import backtrader as bt

class MACDTrendStrategy(bt.Strategy):
    params = dict(
        fast_period=12,
        slow_period=26,
        signal_period=9
    )

    def __init__(self):
        self.macd = bt.ind.MACD(
            period_me1=self.p.fast_period,
            period_me2=self.p.slow_period,
            period_signal=self.p.signal_period
        )

    def next(self):
        if not self.position:
            # Buy when MACD line crosses above signal line (bullish crossover)
            if (self.macd.macd[0] > self.macd.signal[0] and
                self.macd.macd[-1] <= self.macd.signal[-1]):
                self.buy()
        else:
            # Sell when MACD line crosses below signal line (bearish crossover)
            if (self.macd.macd[0] < self.macd.signal[0] and
                self.macd.macd[-1] >= self.macd.signal[-1]):
                self.sell()

# Usage
cerebro = bt.Cerebro()
cerebro.addstrategy(MACDTrendStrategy)
Expected Outcome: By using the MACD indicator, your strategy identifies momentum shifts and trend changes through clear crossover signals, helping you enter trades when momentum is building and exit when momentum is weakening. This approach leads to better trend-following entries, improved momentum confirmation, and enhanced risk management by avoiding trades during uncertain market conditions.
💡 Bonus Tip
Consider using MACD histogram divergence as a confirmation signal. When price makes a new high but the MACD histogram makes a lower high, it suggests weakening upward momentum and potential bearish reversal. This technique, documented in Appel's original methodology, can significantly improve the accuracy of MACD-based trading strategies by identifying trend exhaustion before price reversals occur.
Using the MACD indicator ensures your strategy captures momentum shifts effectively, improving entry and exit timing based on objective momentum and trend analysis.