Stochastic Oscillator Indicator Explanation
The Stochastic Oscillator is a momentum indicator that compares the current closing price to the price range over a specified period to identify overbought and oversold conditions. Developed by George C. Lane in the late 1950s and introduced in his technical analysis work, the Stochastic oscillator oscillates between 0 and 100, providing traders with a normalized view of price momentum that helps identify potential reversal points. The indicator consists of two lines: %K (the fast line) and %D (the slow line, which is a moving average of %K), each providing unique insights into momentum and potential trend reversals.
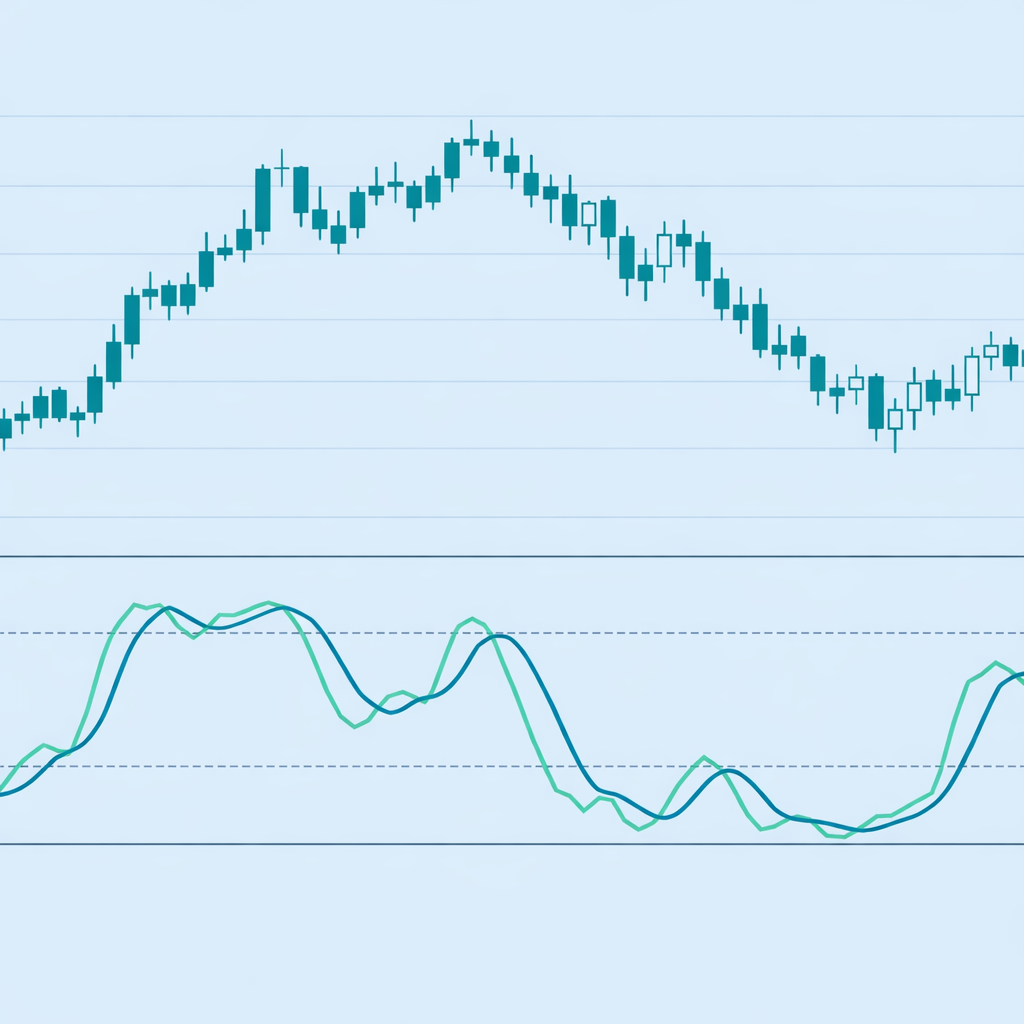
How Stochastic Works: The Stochastic oscillator is calculated using two components. First, %K (the fast stochastic) is computed as: %K = [(Close - Lowest Low) / (Highest High - Lowest Low)] × 100, where Close is the current closing price, Lowest Low is the lowest price over the lookback period (typically 14 periods), and Highest High is the highest price over the same period. The %D line (the slow stochastic) is then calculated as a moving average of %K, typically using a 3-period simple moving average. The indicator oscillates between 0 and 100, where values above 80 typically indicate overbought conditions and values below 20 indicate oversold conditions. The relationship between %K and %D lines provides additional signals, with bullish crossovers (when %K crosses above %D) indicating potential upward momentum and bearish crossovers (when %K crosses below %D) indicating potential downward momentum.
When to Use Stochastic:
- Overbought/Oversold Identification: Stochastic is highly effective at identifying overbought conditions (values above 80) and oversold conditions (values below 20) in ranging or sideways markets, signaling potential reversal opportunities when prices reach extreme levels relative to recent trading ranges.
- Momentum Confirmation: The %K and %D line crossovers help confirm momentum strength and direction. Bullish crossovers (when %K crosses above %D) in oversold territory indicate potential upward momentum, while bearish crossovers (when %K crosses below %D) in overbought territory indicate potential downward momentum.
- Divergence Analysis: Stochastic divergence occurs when price makes new highs or lows while Stochastic fails to confirm, often signaling potential trend reversals. Bullish divergence (price makes lower low, Stochastic makes higher low) suggests upward momentum, while bearish divergence (price makes higher high, Stochastic makes lower high) suggests downward momentum.
Advantages:
- Provides clear, objective signals for overbought and oversold conditions with well-defined thresholds (80 for overbought, 20 for oversold), making it easy to identify potential entry and exit points without subjective interpretation. The dual-line system (%K and %D) enhances signal reliability.
- Works effectively across multiple timeframes and asset classes, including stocks, forex, commodities, and cryptocurrencies, as momentum measurement is universal. The indicator is particularly useful in ranging markets where price oscillates within defined ranges.
- Helps reduce false signals when combined with trend indicators, as Stochastic overbought/oversold conditions are more reliable when confirmed by price action and trend direction. The crossover signals between %K and %D provide additional confirmation.
Limitations:
- Stochastic can remain in overbought or oversold territory for extended periods during strong trends, leading to premature exit signals if used in isolation without trend confirmation. The indicator may give false signals in trending markets where prices continue to move in one direction.
- False signals can occur in ranging markets when Stochastic oscillates between 20 and 80 without clear directional bias, requiring additional confirmation from other indicators or price action analysis. The indicator's sensitivity to price extremes can result in frequent signals during volatile periods.
- The default 14-period setting may not be optimal for all markets and timeframes, requiring parameter optimization based on market characteristics and trading style. Shorter periods increase sensitivity but may produce more false signals, while longer periods reduce sensitivity but may miss trading opportunities.
In summary, Stochastic is a valuable momentum indicator for traders seeking to identify overbought and oversold conditions and potential reversal points, particularly in ranging markets. For comprehensive understanding, refer to Lane's original work on technical analysis, Investopedia's Stochastic guide, TradingView's Stochastic documentation, and academic research on momentum oscillators in technical analysis published in journals such as the Journal of Financial Markets and the Review of Financial Studies.
Practical Example: Using the Stochastic Oscillator Indicator in a Trading Strategy
The Stochastic Oscillator is a momentum indicator used to identify overbought and oversold conditions by comparing the current closing price to the price range over a specified period. In a trading strategy, the Stochastic indicator helps traders make entry and exit decisions based on momentum extremes and potential reversal signals.
Scenario: You're creating a mean-reversion strategy for Gold (XAU/USD) on a 1-hour chart. You want to buy when the asset is oversold (Stochastic below 20) and sell when it's overbought (Stochastic above 80), assuming prices will revert to the mean after reaching extreme momentum levels in a ranging market.
Strategy Logic:
- Calculate the Stochastic(14, 3, 3) to measure current momentum conditions relative to the recent price range. The %K line represents the fast stochastic, while the %D line is a 3-period moving average of %K. The indicator oscillates between 0 and 100, where values below 20 indicate oversold conditions and values above 80 indicate overbought conditions.
- Buy signal: When %K crosses above %D (bullish crossover) in oversold territory (below 20), indicating potential upward momentum reversal and entry opportunity.
- Sell signal: When %K crosses below %D (bearish crossover) in overbought territory (above 80), indicating potential downward momentum reversal and exit opportunity.
Backtrader Example:
import backtrader as bt

class StochasticMeanReversionStrategy(bt.Strategy):
    params = dict(
        stoch_period=14,
        stoch_dfast=3,
        stoch_dslow=3,
        oversold_level=20,
        overbought_level=80
    )

    def __init__(self):
        self.stoch = bt.ind.Stochastic(
            period=self.p.stoch_period,
            period_dfast=self.p.stoch_dfast,
            period_dslow=self.p.stoch_dslow
        )

    def next(self):
        if not self.position:
            # Buy when %K crosses above %D in oversold territory
            if (self.stoch.percK[0] < self.p.oversold_level and
                self.stoch.percK[0] > self.stoch.percD[0] and
                self.stoch.percK[-1] <= self.stoch.percD[-1]):
                self.buy()
        else:
            # Sell when %K crosses below %D in overbought territory
            if (self.stoch.percK[0] > self.p.overbought_level and
                self.stoch.percK[0] < self.stoch.percD[0] and
                self.stoch.percK[-1] >= self.stoch.percD[-1]):
                self.sell()

# Usage
cerebro = bt.Cerebro()
cerebro.addstrategy(StochasticMeanReversionStrategy)
Expected Outcome: By using the Stochastic oscillator, your strategy identifies momentum extremes and potential reversal points, helping you enter trades when prices are likely to revert to the mean after reaching extreme levels. This approach leads to better entry timing, reduced false breakout entries, and improved risk-reward ratios in ranging markets where price oscillates within defined ranges.
💡 Bonus Tip
Consider using Stochastic divergence as a confirmation signal. When price makes a new low but Stochastic makes a higher low, it suggests weakening downward momentum and potential bullish reversal. This technique, documented in Lane's original methodology, can significantly improve the accuracy of Stochastic-based trading strategies by identifying momentum shifts before price reversals occur.
Using the Stochastic oscillator ensures your strategy captures momentum shifts effectively, improving entry and exit timing based on objective momentum measurements relative to recent price ranges.