Ease of Movement Indicator Explanation
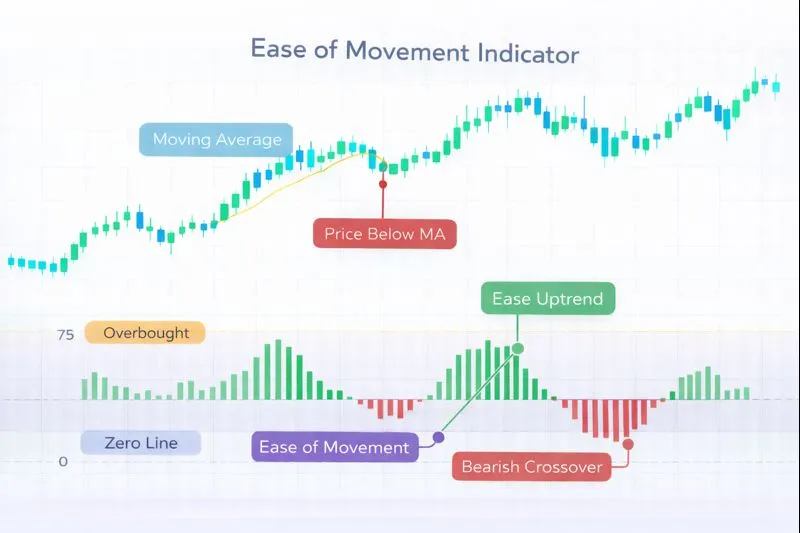
The Ease of Movement (EOM) is a momentum indicator that measures the relationship between price movement and volume, indicating how easily prices move in a particular direction. Developed by Richard W. Arms Jr. in the 1960s and introduced in his book "Volume Cycles in the Stock Market" (1983), EOM compares the price movement (distance moved) to volume, creating a measurement that reflects the ease with which prices move up or down. The indicator oscillates around a zero line, with positive values indicating upward movement with relative ease (high price movement relative to volume) and negative values indicating downward movement with relative ease. EOM helps identify periods when prices move easily (low volume, significant price change) versus periods when prices struggle to move (high volume, small price change).
How Ease of Movement Works: EOM is calculated by comparing the price distance moved to volume over a specified period (typically 14 periods). The formula is: Distance Moved = (Current High + Current Low) / 2 - (Previous High + Previous Low) / 2, Box Ratio = Volume / (High - Low), and EOM = Distance Moved / Box Ratio. The Box Ratio represents the volume required to move prices by one unit, normalizing the measurement. A moving average (typically 14 periods) is often applied to smooth EOM: EOM (smoothed) = SMA(EOM, period). When EOM is positive and rising, it indicates prices are moving up easily with relatively low volume. When EOM is negative and falling, it indicates prices are moving down easily with relatively low volume.
When to Use Ease of Movement:
- Price Movement Efficiency Identification: EOM is highly effective at identifying periods when prices move efficiently (high price movement relative to volume) versus inefficiently (low price movement relative to volume). Positive and rising EOM indicates upward movement with ease, while negative and falling EOM indicates downward movement with ease.
- Trend Strength Confirmation: EOM can confirm trend strength when it moves in the same direction as price. When price is rising and EOM is positive and increasing, it confirms strong upward momentum with low resistance. When price is falling and EOM is negative and decreasing, it confirms strong downward momentum with low resistance.
- Signal Line Crossovers: EOM crossovers with its signal line (typically a 14-period SMA of EOM) and zero line crossovers can generate trading signals. When EOM crosses above zero and its signal line, it generates a bullish signal, and when it crosses below zero and its signal line, it generates a bearish signal.
Advantages:
- Provides clear measurement of price movement efficiency through the relationship between price movement and volume, making it effective for identifying periods of easy price movement versus periods of resistance. The volume normalization adds reliability to momentum signals.
- Works effectively across multiple timeframes and asset classes, including stocks, forex, commodities, and cryptocurrencies, particularly in markets where volume data is available and reliable.
- Helps identify trend changes early through zero line crossovers and signal line crossovers, providing clear signals for entry and exit points. The volume relationship improves reliability.
Limitations:
- EOM requires reliable volume data, which may not be available or accurate in all markets, particularly in forex markets where volume data can be less reliable. The indicator's effectiveness depends on the quality of volume information.
- The indicator can produce false signals in ranging markets when price movements are small and volume oscillates without clear directional bias. EOM works best in trending markets where volume confirms price direction.
- EOM does not provide information about overbought or oversold conditions on its own, only price movement efficiency. Traders should combine it with other indicators for more comprehensive analysis.
In summary, EOM is a valuable momentum indicator that measures price movement efficiency through price-volume relationships, making it ideal for identifying periods of easy price movement and trend strength. For comprehensive understanding, refer to Arms' original work "Volume Cycles in the Stock Market" (1983), Investopedia's EOM guide, TradingView's EOM documentation, and academic research on momentum indicators in technical analysis published in journals such as the Journal of Financial Markets and the Review of Financial Studies.
Practical Example: Using the Ease of Movement Indicator in a Trading Strategy
The Ease of Movement (EOM) is a momentum indicator used to identify price movement efficiency through price-volume relationships. In a trading strategy, the EOM indicator helps traders make entry and exit decisions based on trend strength and ease of price movement.
Scenario: You're creating a trend-following strategy for Bitcoin (BTC/USDT) on a 4-hour chart. You want to buy when EOM crosses above zero and above its signal line (indicating upward movement with ease), and sell when it crosses below zero or below its signal line (indicating downward movement with ease).
Strategy Logic:
- Calculate the EOM(14) using a 14-period smoothing. EOM = Distance Moved / Box Ratio, where Distance Moved = (Current High + Low) / 2 - (Previous High + Low) / 2, and Box Ratio = Volume / (High - Low). The EOM oscillates around zero, with positive values indicating upward movement with ease and negative values indicating downward movement with ease.
- Buy signal: When EOM crosses above zero and above its signal line, indicating upward movement beginning with relative ease and low resistance.
- Sell signal: When EOM crosses below zero or below its signal line, indicating downward movement beginning or upward movement weakening.
Backtrader Example:
import backtrader as bt

class EOMTrendStrategy(bt.Strategy):
    params = dict(
        eom_period=14
    )

    def __init__(self):
        # Calculate EOM: Distance Moved / Box Ratio
        # Distance Moved = (Current High + Low) / 2 - (Previous High + Low) / 2
        mid_price = (self.data.high + self.data.low) / 2
        previous_mid_price = bt.ind.Delay(mid_price, period=1)
        distance_moved = mid_price - previous_mid_price

        # Box Ratio = Volume / (High - Low)
        price_range = self.data.high - self.data.low
        box_ratio = self.data.volume / bt.ind.If(price_range > 0, price_range, 1.0)

        # EOM = Distance Moved / Box Ratio
        eom = distance_moved / bt.ind.If(box_ratio > 0, box_ratio, 1.0)
        # Smooth with SMA
        self.eom = bt.ind.SMA(eom, period=self.p.eom_period)
        self.signal = self.eom  # Can use different period for signal

    def next(self):
        if not self.position:
            # Buy when EOM crosses above zero and signal line
            if (self.eom[0] > 0 and self.eom[0] > self.signal[0] and
                self.eom[-1] <= self.signal[-1]):
                self.buy()
        else:
            # Sell when EOM crosses below zero or signal line
            if (self.eom[0] < 0 or
                (self.eom[0] < self.signal[0] and self.eom[-1] >= self.signal[-1])):
                self.sell()

# Usage
cerebro = bt.Cerebro()
cerebro.addstrategy(EOMTrendStrategy)
Expected Outcome: By using the EOM indicator, your strategy identifies price movement efficiency through price-volume relationships, helping you enter trades when prices move easily in the direction of the trend and exit when movement becomes difficult or reverses. This approach leads to better trend-following entries, improved movement efficiency identification, and enhanced signal reliability by combining price movement with volume relationships.
💡 Bonus Tip
Consider using EOM in combination with price action analysis for confirmation. When EOM is positive and price is making higher highs and higher lows with relatively low volume, it suggests strong upward momentum with low resistance and higher probability of trend continuation. This technique, documented in technical analysis literature, can significantly improve the accuracy of EOM-based trading strategies.
Using the EOM indicator ensures your strategy captures price movement efficiency effectively, improving entry and exit timing based on price-volume momentum analysis.