Elder Ray Index Indicator Explanation
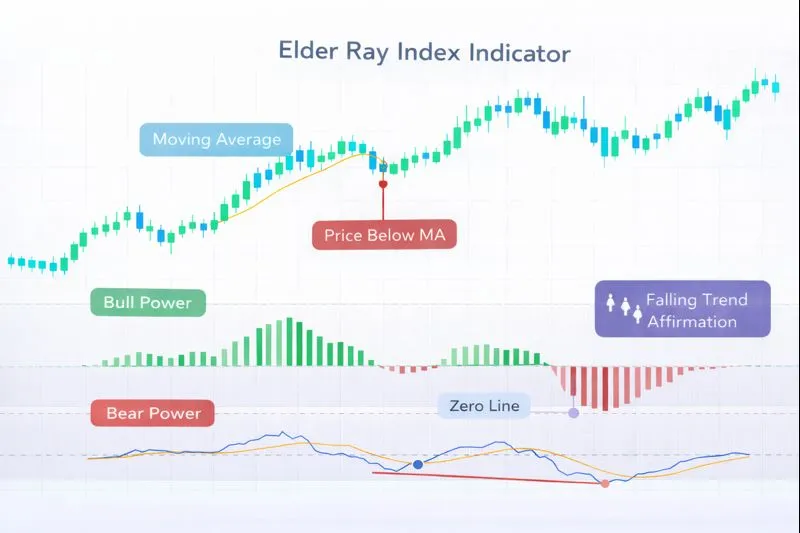
The Elder Ray Index is a momentum indicator that measures buying and selling pressure by comparing the high and low prices of each period to an exponential moving average (EMA). Developed by Dr. Alexander Elder in the 1980s and introduced in his book "Trading for a Living" (1993), the Elder Ray Index consists of two components: Bull Power (the difference between the high price and the EMA) and Bear Power (the difference between the low price and the EMA). These two components help traders identify the strength of buying and selling pressure relative to the average price, making it effective for identifying trend changes and momentum shifts.
How Elder Ray Index Works: The Elder Ray Index calculates Bull Power and Bear Power by comparing each period's high and low prices to an EMA (typically 13 periods). Bull Power = High - EMA, and Bear Power = Low - EMA. When Bull Power is positive and rising, it indicates strong buying pressure and upward momentum. When Bear Power is negative and falling (becoming more negative), it indicates strong selling pressure and downward momentum. When both Bull Power and Bear Power are near zero, it suggests a lack of directional momentum and potential trend exhaustion. The indicator works best when combined with the EMA trend direction for confirmation.
When to Use Elder Ray Index:
- Buying and Selling Pressure Identification: The Elder Ray Index is highly effective at identifying buying and selling pressure relative to the average price. Positive and rising Bull Power indicates strong buying pressure, while negative and falling Bear Power indicates strong selling pressure. The combination of both components provides a comprehensive view of market forces.
- Divergence Analysis: Elder Ray divergence occurs when price makes new highs or lows while Bull Power or Bear Power fails to confirm, often signaling potential trend reversals. Bullish divergence (price makes lower low, Bull Power makes higher low) suggests upward momentum building, while bearish divergence (price makes higher high, Bear Power makes lower high) suggests downward momentum building.
- Entry and Exit Signals: Elder Ray Index generates buy signals when Bull Power crosses above zero while price is above the EMA (confirming upward momentum), and sell signals when Bear Power crosses below zero while price is below the EMA (confirming downward momentum). The combination with EMA trend direction improves signal reliability.
Advantages:
- Provides clear, objective measures of buying and selling pressure through separate Bull Power and Bear Power components, making it easier to identify market forces. The comparison to EMA provides context relative to the average price.
- Works effectively across multiple timeframes and asset classes, including stocks, forex, commodities, and cryptocurrencies. The indicator adapts well to different market conditions and volatility levels.
- Helps identify momentum shifts early through divergence analysis and zero line crossovers, providing clear signals for entry and exit points. The combination with EMA trend direction ensures reliability.
Limitations:
- Elder Ray Index requires combination with EMA trend direction for reliable signals, as Bull Power and Bear Power alone may not provide clear directional bias. The indicator works best when used with trend confirmation.
- The indicator may produce false signals in ranging markets when Bull Power and Bear Power oscillate around zero without clear directional movement. Elder Ray Index works best in trending markets where momentum is more clearly defined.
- Elder Ray Index does not provide information about overbought or oversold conditions on its own, only buying and selling pressure relative to the EMA. Traders should combine it with other indicators for more comprehensive analysis.
In summary, the Elder Ray Index is a valuable momentum indicator that provides separate measures of buying and selling pressure, making it ideal for identifying trend changes and momentum shifts through comprehensive market force analysis. For comprehensive understanding, refer to Elder's original work "Trading for a Living" (1993), Investopedia's Elder Ray Index guide, TradingView's Elder Ray Index documentation, and academic research on momentum indicators in technical analysis published in journals such as the Journal of Financial Markets and the Review of Financial Studies.
Practical Example: Using the Elder Ray Index Indicator in a Trading Strategy
The Elder Ray Index is a momentum indicator used to identify buying and selling pressure through Bull Power and Bear Power analysis. In a trading strategy, the Elder Ray Index indicator helps traders make entry and exit decisions based on momentum direction and zero line crossovers combined with EMA trend confirmation.
Scenario: You're creating a trend-following strategy for EUR/USD on a 4-hour chart. You want to buy when Bull Power crosses above zero while price is above the EMA (indicating upward momentum), and sell when Bear Power crosses below zero while price is below the EMA (indicating downward momentum).
Strategy Logic:
- Calculate the Elder Ray Index(13) using a 13-period EMA. Bull Power = High - EMA, and Bear Power = Low - EMA. Positive and rising Bull Power indicates strong buying pressure, while negative and falling Bear Power indicates strong selling pressure.
- Buy signal: When price is above the EMA, and Bull Power crosses above zero, indicating strong buying pressure and upward momentum beginning.
- Sell signal: When price is below the EMA, and Bear Power crosses below zero, indicating strong selling pressure and downward momentum beginning.
Backtrader Example:
import backtrader as bt

class ElderRayTrendStrategy(bt.Strategy):
    params = dict(
        ema_period=13
    )

    def __init__(self):
        self.ema = bt.ind.EMA(period=self.p.ema_period)
        # Calculate Bull Power: High - EMA
        self.bull_power = self.data.high - self.ema
        # Calculate Bear Power: Low - EMA
        self.bear_power = self.data.low - self.ema

    def next(self):
        if not self.position:
            # Buy when price is above EMA and Bull Power crosses above zero
            if (self.data.close[0] > self.ema[0] and
                self.bull_power[0] > 0 and self.bull_power[-1] <= 0):
                self.buy()
        else:
            # Sell when price is below EMA and Bear Power crosses below zero
            if (self.data.close[0] < self.ema[0] and
                self.bear_power[0] < 0 and self.bear_power[-1] >= 0):
                self.sell()

# Usage
cerebro = bt.Cerebro()
cerebro.addstrategy(ElderRayTrendStrategy)
Expected Outcome: By using the Elder Ray Index indicator, your strategy identifies buying and selling pressure through Bull Power and Bear Power analysis, helping you enter trades when momentum is building in the direction of the trend and exit when momentum weakens or reverses. This approach leads to better trend-following entries, improved momentum identification, and enhanced signal reliability by combining pressure indicators with trend confirmation.
💡 Bonus Tip
Consider using Elder Ray Index divergence as a confirmation signal. When price makes a new high but Bull Power makes a lower high, it suggests weakening upward momentum and potential bearish reversal. This technique, documented in Elder's original methodology, can significantly improve the accuracy of Elder Ray Index-based trading strategies.
Using the Elder Ray Index indicator ensures your strategy captures buying and selling pressure effectively, improving entry and exit timing based on comprehensive market force analysis.