Money Flow Indicator Explanation
The Money Flow is a momentum indicator that combines price movement and volume to measure the flow of money into or out of a security. Developed by Marc Chaikin in the 1970s, Money Flow is calculated using the typical price (average of high, low, and close) and volume, creating a measurement that reflects both price direction and the conviction behind it. The indicator accumulates positive money flow (when typical price increases) and negative money flow (when typical price decreases) over a specified period, providing a cumulative measure of buying and selling pressure. Money Flow is often used as the basis for other indicators like the Money Flow Index (MFI) and Chaikin Money Flow.
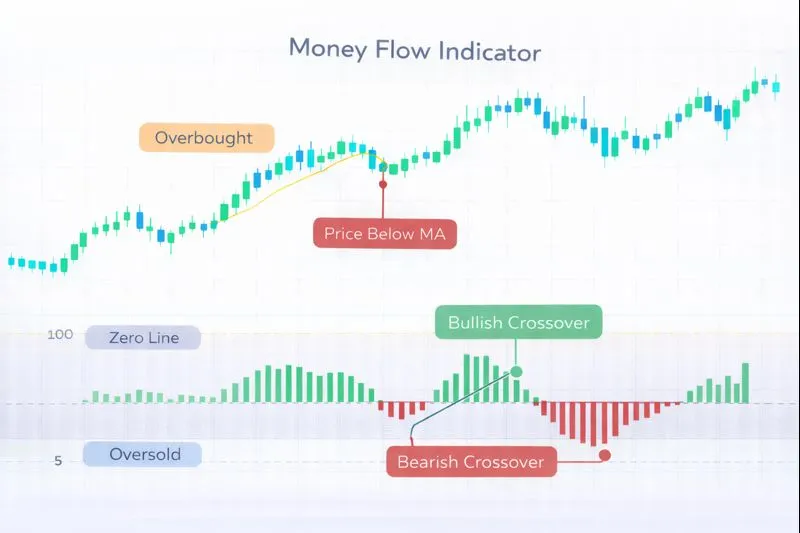
How Money Flow Works: Money Flow is calculated using the typical price (TP) and volume: Typical Price = (High + Low + Close) / 3, and Money Flow = Typical Price × Volume. Positive Money Flow occurs when the current typical price is higher than the previous typical price, indicating buying pressure. Negative Money Flow occurs when the current typical price is lower than the previous typical price, indicating selling pressure. The cumulative Money Flow over a specified period (typically 14 periods) provides a measure of net money flow: Cumulative Money Flow = Sum of Positive Money Flow - Sum of Negative Money Flow. The Money Flow Index (MFI) normalizes this to a 0-100 scale: MFI = 100 - (100 / (1 + Positive Money Flow / Negative Money Flow)).
When to Use Money Flow:
- Buying and Selling Pressure Identification: Money Flow is highly effective at identifying the strength of buying and selling pressure through the combination of price movement and volume. Positive and rising Money Flow indicates strong buying pressure, while negative and falling Money Flow indicates strong selling pressure. The volume component provides conviction measurement.
- Divergence Analysis: Money Flow divergence occurs when price makes new highs or lows while Money Flow fails to confirm, often signaling potential trend reversals. Bullish divergence (price makes lower low, Money Flow makes higher low) suggests upward pressure building, while bearish divergence (price makes higher high, Money Flow makes lower high) suggests downward pressure building.
- Trend Confirmation: Money Flow can confirm trend strength when it moves in the same direction as price. When price is rising and Money Flow is positive and increasing, it confirms strong upward momentum. When price is falling and Money Flow is negative and decreasing, it confirms strong downward momentum.
Advantages:
- Provides clear measurement of buying and selling pressure through the combination of typical price and volume, making it effective for identifying trend strength and conviction. The volume component adds reliability to momentum signals.
- Works effectively across multiple timeframes and asset classes, including stocks, forex, commodities, and cryptocurrencies, particularly in markets where volume data is available and reliable.
- Helps identify trend changes early through divergence analysis and cumulative money flow patterns, providing clear signals for entry and exit points. The volume confirmation improves reliability.
Limitations:
- Money Flow requires reliable volume data, which may not be available or accurate in all markets, particularly in forex markets where volume data can be less reliable. The indicator's effectiveness depends on the quality of volume information.
- The indicator can produce false signals in ranging markets when price movements are small and volume oscillates without clear directional bias. Money Flow works best in trending markets where volume confirms price direction.
- Money Flow does not provide information about overbought or oversold conditions on its own, only buying and selling pressure. The Money Flow Index (MFI) normalizes this to provide overbought/oversold readings.
In summary, Money Flow is a valuable momentum indicator that measures buying and selling pressure through price-volume analysis, making it ideal for identifying trend strength and conviction. For comprehensive understanding, refer to Chaikin's original work on Money Flow, Investopedia's Money Flow guide, TradingView's Money Flow documentation, and academic research on momentum indicators in technical analysis published in journals such as the Journal of Financial Markets and the Review of Financial Studies.
Practical Example: Using the Money Flow Indicator in a Trading Strategy
The Money Flow is a momentum indicator used to identify buying and selling pressure through price-volume analysis using typical price. In a trading strategy, the Money Flow indicator helps traders make entry and exit decisions based on trend strength and cumulative money flow patterns.
Scenario: You're creating a trend-following strategy for Gold (XAU/USD) on a 4-hour chart. You want to buy when Money Flow is positive and increasing (indicating strong buying pressure), and sell when Money Flow is negative and decreasing (indicating strong selling pressure).
Strategy Logic:
- Calculate the Money Flow using typical price and volume. Typical Price = (High + Low + Close) / 3, and Money Flow = Typical Price × Volume. Positive Money Flow indicates buying pressure, while negative Money Flow indicates selling pressure.
- Buy signal: When cumulative Money Flow crosses above zero and continues to rise, indicating strong buying pressure beginning with volume confirmation.
- Sell signal: When cumulative Money Flow crosses below zero or continues to fall, indicating strong selling pressure beginning or buying pressure weakening.
Backtrader Example:
import backtrader as bt

class MoneyFlowTrendStrategy(bt.Strategy):
    params = dict(
        mf_period=14
    )

    def __init__(self):
        # Calculate Typical Price
        self.typical_price = (self.data.high + self.data.low + self.data.close) / 3
        # Calculate Money Flow: Typical Price × Volume
        self.money_flow = self.typical_price * self.data.volume
        # Calculate positive and negative money flow
        price_change = self.typical_price - bt.ind.Delay(self.typical_price, period=1)
        positive_mf = bt.ind.SumIf(self.money_flow, price_change > 0, period=self.p.mf_period)
        negative_mf = bt.ind.SumIf(self.money_flow, price_change < 0, period=self.p.mf_period)
        # Cumulative Money Flow
        self.cumulative_mf = positive_mf - negative_mf

    def next(self):
        if not self.position:
            # Buy when cumulative Money Flow crosses above zero and rising
            if (self.cumulative_mf[0] > 0 and self.cumulative_mf[0] > self.cumulative_mf[-1] and
                self.cumulative_mf[-1] <= 0):
                self.buy()
        else:
            # Sell when cumulative Money Flow crosses below zero or falling
            if (self.cumulative_mf[0] < 0 or
                (self.cumulative_mf[0] < self.cumulative_mf[-1] and self.cumulative_mf[-1] >= 0)):
                self.sell()

# Usage
cerebro = bt.Cerebro()
cerebro.addstrategy(MoneyFlowTrendStrategy)
Expected Outcome: By using the Money Flow indicator, your strategy identifies buying and selling pressure through price-volume analysis, helping you enter trades when trend strength is building and exit when pressure weakens or reverses. This approach leads to better trend-following entries, improved conviction identification, and enhanced signal reliability by combining price movement with volume confirmation.
💡 Bonus Tip
Consider using Money Flow divergence as a confirmation signal. When price makes a new high but Money Flow makes a lower high, it suggests weakening upward pressure and potential bearish reversal. This technique, documented in technical analysis literature, can significantly improve the accuracy of Money Flow-based trading strategies.
Using the Money Flow indicator ensures your strategy captures buying and selling pressure effectively, improving entry and exit timing based on price-volume momentum analysis.