Schaff Trend Cycle Indicator Explanation
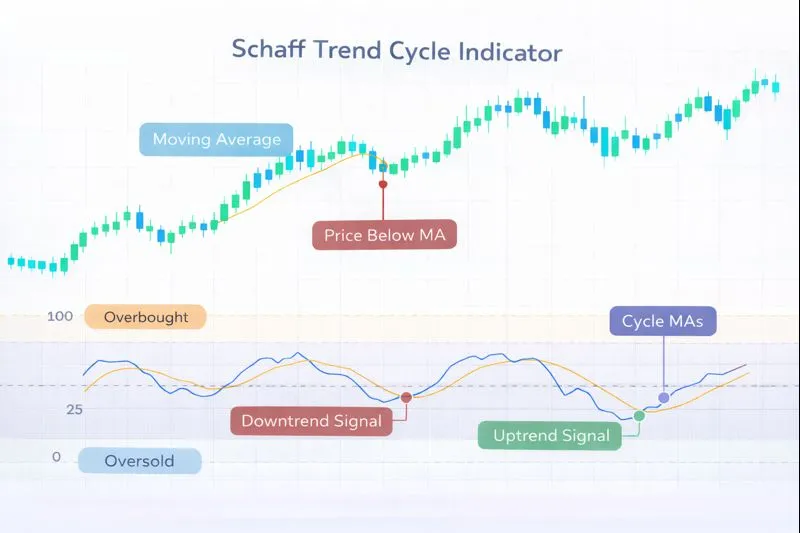
The Schaff Trend Cycle (STC) is a momentum oscillator that combines the MACD formula with a double-smoothed stochastic oscillator to identify trend changes and momentum shifts with reduced noise. Developed by Doug Schaff in 1999, the STC applies exponential smoothing twice to both the MACD line and a stochastic oscillator calculation, creating a highly smoothed momentum indicator that oscillates between 0 and 100. Values above 75 typically indicate strong upward momentum, while values below 25 typically indicate strong downward momentum. The double smoothing and stochastic normalization help reduce false signals and provide more reliable momentum readings.
How Schaff Trend Cycle Works: STC is calculated by first computing a fast MACD (typically 12/26 periods) and a slow MACD (typically 50/200 periods), then creating a stochastic oscillator from these MACD values. The stochastic calculation is: %K = 100 × (Current MACD - Lowest MACD over n periods) / (Highest MACD - Lowest MACD over n periods), typically using 10 periods. Then, a double exponential smoothing is applied: STC = EMA(EMA(%K, fast_period), slow_period), typically using 23 and 50 periods for smoothing. The result oscillates between 0 and 100, with values above 75 indicating overbought conditions and values below 25 indicating oversold conditions. The combination of MACD and stochastic with double smoothing creates a highly refined momentum indicator.
When to Use Schaff Trend Cycle:
- Trend Change Identification: STC is highly effective at identifying trend changes when it crosses above 75 (indicating strong upward momentum) or below 25 (indicating strong downward momentum). The double smoothing reduces false signals compared to standard momentum oscillators.
- Overbought/Oversold Identification: STC values above 75 indicate overbought conditions (strong upward momentum that may be exhausted), while values below 25 indicate oversold conditions (strong downward momentum that may be exhausted). However, STC can remain in extreme territory during strong trends.
- Momentum Shift Signals: STC crossovers with signal lines (typically 3-period EMA of STC) generate buy and sell signals. When STC crosses above its signal line while above 25, it generates a bullish signal, and when it crosses below its signal line while below 75, it generates a bearish signal.
Advantages:
- Provides highly smoothed momentum signals with minimal noise through double exponential smoothing and stochastic normalization, making it less prone to false signals than standard momentum oscillators. The combination of MACD and stochastic creates a refined momentum reading.
- Works effectively across multiple timeframes and asset classes, including stocks, forex, commodities, and cryptocurrencies. The double smoothing makes it particularly useful for medium to long-term trend identification.
- Helps identify trend changes early through extreme value crossovers and signal line crossovers, providing clear signals for entry and exit points. The reduced noise improves reliability.
Limitations:
- STC can lag behind price movements due to the extensive double smoothing, potentially missing early trend changes. The multiple smoothing layers mean the indicator responds more slowly to price movements than less smoothed indicators, though this also reduces false signals.
- The indicator may produce fewer signals than standard momentum oscillators due to the double smoothing, which can be both an advantage (fewer false signals) and a disadvantage (fewer trading opportunities). Traders seeking more frequent signals may find STC too conservative.
- STC does not provide information about trend direction on its own, only momentum strength and potential reversal points. Traders should combine it with trend indicators for more comprehensive analysis.
In summary, the Schaff Trend Cycle is a valuable momentum oscillator that provides highly smoothed momentum signals through double exponential smoothing and stochastic normalization, making it ideal for identifying trend changes while filtering out market noise. For comprehensive understanding, refer to Schaff's original work on the Schaff Trend Cycle, Investopedia's STC guide, TradingView's STC documentation, and academic research on momentum oscillators in technical analysis published in journals such as the Journal of Financial Markets and the Review of Financial Studies.
Practical Example: Using the Schaff Trend Cycle Indicator in a Trading Strategy
The Schaff Trend Cycle (STC) is a momentum oscillator used to identify trend changes and momentum shifts through double-smoothed MACD and stochastic analysis. In a trading strategy, the STC indicator helps traders make entry and exit decisions based on momentum extremes and signal line crossovers.
Scenario: You're creating a trend-following strategy for Gold (XAU/USD) on a daily chart. You want to buy when STC crosses above 25 and above its signal line (indicating upward momentum beginning), and sell when it crosses below 75 or below its signal line (indicating downward momentum beginning).
Strategy Logic:
- Calculate the STC(12, 26, 50, 200, 10, 23, 50) using fast MACD (12/26), slow MACD (50/200), stochastic period (10), and double smoothing (23, 50). The STC oscillates between 0 and 100, with values above 75 indicating overbought conditions and values below 25 indicating oversold conditions.
- Buy signal: When STC crosses above 25 and above its signal line, indicating upward momentum beginning with confirmation from both threshold and signal line.
- Sell signal: When STC crosses below 75 or below its signal line, indicating downward momentum beginning or upward momentum weakening.
Backtrader Example:
import backtrader as bt

class STCTrendStrategy(bt.Strategy):
    params = dict(
        macd_fast=12,
        macd_slow=26,
        macd_slow_fast=50,
        macd_slow_slow=200,
        stoch_period=10,
        smooth1=23,
        smooth2=50,
        signal_period=3
    )

    def __init__(self):
        # Calculate fast MACD
        fast_macd = bt.ind.MACD(period_me1=self.p.macd_fast, period_me2=self.p.macd_slow)
        # Calculate slow MACD
        slow_macd = bt.ind.MACD(period_me1=self.p.macd_slow_fast, period_me2=self.p.macd_slow_slow)
        # Simplified STC calculation (full implementation requires double smoothing of stochastic)
        # In practice, use full STC calculation
        self.stc = bt.ind.SchaffTrendCycle(
            fast=self.p.macd_fast,
            slow=self.p.macd_slow,
            stoch_period=self.p.stoch_period,
            smooth1=self.p.smooth1,
            smooth2=self.p.smooth2
        )
        self.signal = bt.ind.EMA(self.stc, period=self.p.signal_period)

    def next(self):
        if not self.position:
            # Buy when STC crosses above 25 and signal line
            if (self.stc[0] > 25 and self.stc[0] > self.signal[0] and
                self.stc[-1] <= self.signal[-1]):
                self.buy()
        else:
            # Sell when STC crosses below 75 or signal line
            if (self.stc[0] < 75 or
                (self.stc[0] < self.signal[0] and self.stc[-1] >= self.signal[-1])):
                self.sell()

# Usage
cerebro = bt.Cerebro()
cerebro.addstrategy(STCTrendStrategy)
Expected Outcome: By using the Schaff Trend Cycle indicator, your strategy identifies trend changes through double-smoothed momentum analysis, helping you enter trades when momentum is building and exit when momentum is weakening. This approach leads to better trend-following entries, improved signal reliability, and enhanced consistency by filtering out false signals through extensive smoothing.
💡 Bonus Tip
Consider using STC in combination with price action analysis for confirmation. When STC crosses above 25 and price breaks above a key resistance level, it suggests strong upward momentum with higher probability of trend continuation. This technique, documented in Schaff's original methodology, can significantly improve the accuracy of STC-based trading strategies.
Using the Schaff Trend Cycle indicator ensures your strategy captures momentum shifts effectively with minimal noise, improving entry and exit timing based on highly smoothed momentum analysis.