Ultimate Oscillator Indicator Explanation
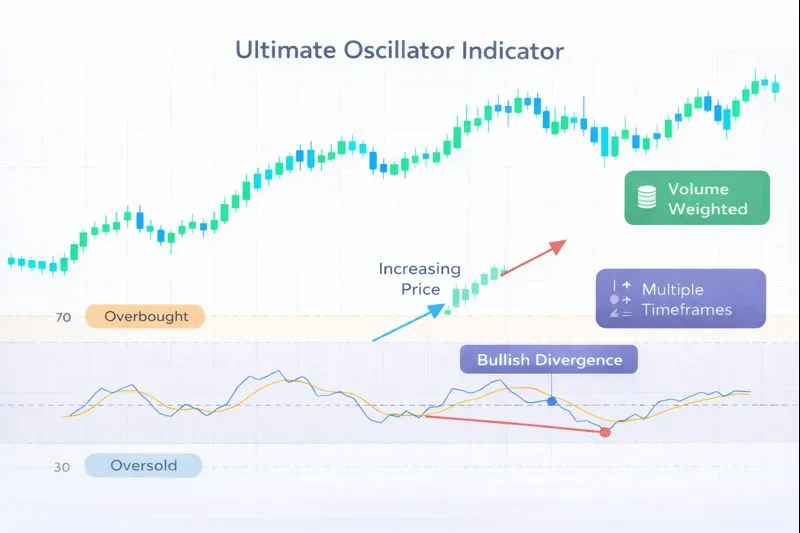
The Ultimate Oscillator is a momentum oscillator that uses weighted sums of buying and selling pressure across three different timeframes to identify overbought and oversold conditions. Developed by Larry Williams in 1976 and introduced in his book "How I Made One Million Dollars Last Year Trading Commodities" (1979), the Ultimate Oscillator combines short-term (7-period), medium-term (14-period), and long-term (28-period) momentum calculations into a single indicator. The indicator oscillates between 0 and 100, with values above 70 typically indicating overbought conditions and values below 30 typically indicating oversold conditions. The multi-timeframe approach helps reduce false signals and provides more reliable momentum readings.
How Ultimate Oscillator Works: The Ultimate Oscillator calculates buying pressure (BP) and true range (TR) for each period, then sums them over three different periods (7, 14, and 28). Buying Pressure = Close - Minimum of (Low, Previous Close), and True Range = Maximum of (High - Low, |High - Previous Close|, |Low - Previous Close|). The Average Buying Pressure (AvgBP) and Average True Range (AvgTR) are calculated for each period (7, 14, 28), then combined with weights: Ultimate Oscillator = 100 × [(4 × AvgBP7/AvgTR7) + (2 × AvgBP14/AvgTR14) + (AvgBP28/AvgTR28)] / (4 + 2 + 1). The 4:2:1 weighting gives more importance to short-term momentum (7-period) while still incorporating longer-term context (28-period), creating a balanced momentum reading.
When to Use Ultimate Oscillator:
- Multi-Timeframe Overbought/Oversold Identification: The Ultimate Oscillator is highly effective at identifying overbought and oversold conditions through multi-timeframe analysis. Values above 70 indicate overbought conditions, while values below 30 indicate oversold conditions. The multi-timeframe weighting reduces false signals compared to single-timeframe oscillators.
- Divergence Analysis: Ultimate Oscillator divergence occurs when price makes new highs or lows while the oscillator fails to confirm, often signaling potential trend reversals. Bullish divergence (price makes lower low, UO makes higher low) suggests upward momentum building, while bearish divergence (price makes higher high, UO makes lower high) suggests downward momentum building.
- Buy/Sell Signal Generation: Williams identified specific buy and sell signal patterns. A buy signal occurs when the Ultimate Oscillator makes a low below 30, then rises above the previous low before the previous low + 1, indicating bullish momentum shift. A sell signal occurs when it makes a high above 70, then falls below the previous high before the previous high - 1, indicating bearish momentum shift.
Advantages:
- Provides multi-timeframe momentum analysis that reduces false signals compared to single-timeframe oscillators. The weighted combination of short, medium, and long-term momentum creates a balanced reading that filters out noise.
- Works effectively across multiple timeframes and asset classes, including stocks, forex, commodities, and cryptocurrencies. The multi-timeframe approach adapts well to different market conditions.
- Helps identify momentum shifts early through divergence analysis and Williams' specific buy/sell signal patterns, providing clear entry and exit signals. The multi-timeframe weighting ensures reliability.
Limitations:
- The Ultimate Oscillator can still produce false signals in strong trends when it remains in overbought or oversold territory for extended periods, similar to other oscillators. The indicator may give premature signals in trending markets.
- The indicator may lag behind price movements during rapid market changes, as it relies on multiple period calculations. The multi-timeframe approach, while reducing false signals, can delay entry and exit signals.
- Ultimate Oscillator does not provide information about trend direction on its own, only momentum strength and potential reversal points. Traders should combine it with trend indicators for more comprehensive analysis.
In summary, the Ultimate Oscillator is a valuable momentum oscillator that provides multi-timeframe momentum analysis, making it ideal for identifying overbought/oversold conditions with reduced false signals. For comprehensive understanding, refer to Williams' original work "How I Made One Million Dollars Last Year Trading Commodities" (1979), Investopedia's Ultimate Oscillator guide, TradingView's Ultimate Oscillator documentation, and academic research on multi-timeframe momentum oscillators in technical analysis published in journals such as the Journal of Financial Markets and the Review of Financial Studies.
Practical Example: Using the Ultimate Oscillator Indicator in a Trading Strategy
The Ultimate Oscillator is a momentum oscillator used to identify overbought and oversold conditions through multi-timeframe momentum analysis. In a trading strategy, the Ultimate Oscillator indicator helps traders make entry and exit decisions based on momentum extremes and Williams' buy/sell signal patterns.
Scenario: You're creating a mean-reversion strategy for EUR/USD on a 4-hour chart. You want to buy when the Ultimate Oscillator shows a buy signal (drops below 30, then rises above previous low) and sell when it shows a sell signal (rises above 70, then falls below previous high), assuming prices will revert to the mean.
Strategy Logic:
- Calculate the Ultimate Oscillator(7, 14, 28) using 7, 14, and 28-period calculations with 4:2:1 weighting. The oscillator oscillates between 0 and 100, where values below 30 indicate oversold conditions and values above 70 indicate overbought conditions. The multi-timeframe approach reduces false signals.
- Buy signal: When the Ultimate Oscillator makes a low below 30, then rises above the previous low + 1, indicating bullish momentum shift and oversold condition reversal (Williams' buy signal pattern).
- Sell signal: When the Ultimate Oscillator makes a high above 70, then falls below the previous high - 1, indicating bearish momentum shift and overbought condition reversal (Williams' sell signal pattern).
Backtrader Example:
import backtrader as bt

class UltimateOscillatorMeanReversionStrategy(bt.Strategy):
    params = dict(
        period1=7,
        period2=14,
        period3=28
    )

    def __init__(self):
        # Calculate Ultimate Oscillator with multi-timeframe weighted approach
        # Simplified - in practice, use full UO calculation
        self.uo = bt.ind.UltimateOscillator(
            period1=self.p.period1,
            period2=self.p.period2,
            period3=self.p.period3
        )
        self.low_below_30 = False
        self.previous_low = None

    def next(self):
        if self.uo[0] < 30:
            self.low_below_30 = True
            self.previous_low = self.uo[0]

        if not self.position:
            # Buy signal: UO dropped below 30, then rose above previous low + 1
            if (self.low_below_30 and self.previous_low is not None and
                self.uo[0] > self.previous_low + 1):
                self.buy()
                self.low_below_30 = False
        else:
            # Sell signal: UO rose above 70, then fell below previous high - 1
            if self.uo[0] > 70:
                previous_high = self.uo[0]
            if self.uo[0] < previous_high - 1:
                self.sell()

# Usage
cerebro = bt.Cerebro()
cerebro.addstrategy(UltimateOscillatorMeanReversionStrategy)
Expected Outcome: By using the Ultimate Oscillator indicator, your strategy identifies overbought and oversold conditions through multi-timeframe analysis, helping you enter trades when momentum extremes are likely to revert. This approach leads to better mean-reversion entries, improved signal reliability, and enhanced risk-reward ratios in ranging markets where multi-timeframe confirmation reduces false signals.
💡 Bonus Tip
Consider using Ultimate Oscillator divergence as a confirmation signal. When price makes a new low but the Ultimate Oscillator makes a higher low, it suggests weakening downward momentum and potential bullish reversal. This technique, documented in Williams' original methodology, can significantly improve the accuracy of Ultimate Oscillator-based trading strategies.
Using the Ultimate Oscillator indicator ensures your strategy identifies momentum extremes effectively with multi-timeframe confirmation, improving entry and exit timing based on balanced momentum analysis.