Awesome Oscillator Indicator Explanation
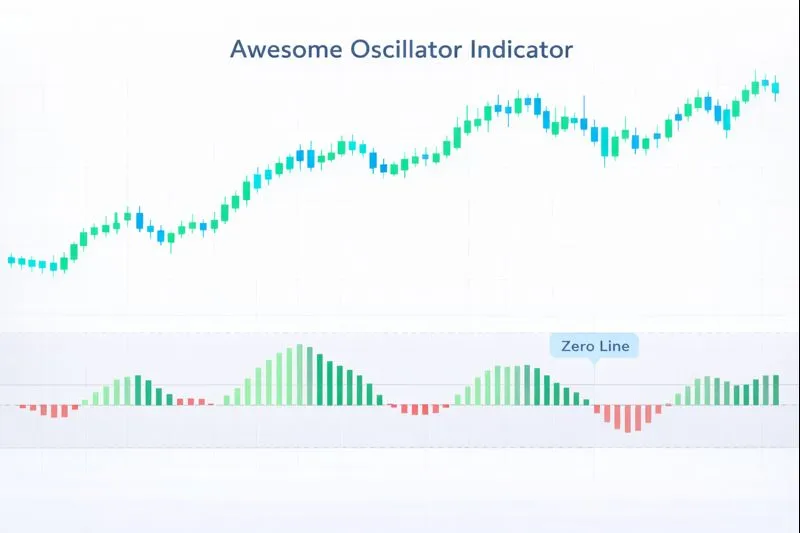
The Awesome Oscillator (AO) is a momentum indicator that measures market momentum using the difference between two simple moving averages (SMAs) of different periods. Developed by Bill Williams, a renowned trader and author, in the 1990s and introduced in his book "Trading Chaos: Applying Expert Techniques to Maximize Your Profits" (1995), the Awesome Oscillator uses a 5-period SMA and a 34-period SMA to identify momentum shifts. The indicator is displayed as a histogram that oscillates around a zero line, with positive values (green bars) indicating upward momentum and negative values (red bars) indicating downward momentum. The Awesome Oscillator is a key component of Bill Williams' trading system and helps identify momentum changes and potential trend reversals.
How Awesome Oscillator Works: The Awesome Oscillator is calculated as the difference between a 5-period SMA and a 34-period SMA of the median price (typical price): AO = SMA(5) of Median Price - SMA(34) of Median Price, where Median Price = (High + Low) / 2. The result is displayed as a histogram with bars above the zero line (positive momentum) and bars below the zero line (negative momentum). The color of the bars changes based on momentum direction: green when the current bar is higher than the previous bar (increasing momentum) and red when the current bar is lower than the previous bar (decreasing momentum). The indicator helps identify momentum shifts through histogram patterns and zero line crossovers.
When to Use Awesome Oscillator:
- Momentum Shift Identification: The Awesome Oscillator is highly effective at identifying momentum shifts through zero line crossovers and histogram patterns. When the histogram crosses above zero, it signals potential upward momentum, and when it crosses below zero, it signals potential downward momentum.
- Saucer Pattern Recognition: Bill Williams identified specific patterns in the Awesome Oscillator histogram, such as "saucer" patterns (three consecutive bars of the same color), which can signal momentum acceleration and potential trend continuation. These patterns help identify strong momentum moves.
- Divergence Analysis: Awesome Oscillator divergence occurs when price makes new highs or lows while the oscillator fails to confirm, often signaling potential trend reversals. Bullish divergence (price makes lower low, AO makes higher low) suggests upward momentum building.
Advantages:
- Provides clear, visual momentum signals through histogram representation, making it easy to identify momentum direction and strength. The color coding (green/red) helps traders quickly assess momentum changes.
- Works effectively across multiple timeframes and asset classes, including stocks, forex, commodities, and cryptocurrencies. The indicator is particularly useful for short to medium-term momentum analysis.
- Helps identify momentum shifts early through zero line crossovers and histogram patterns, providing clear signals for entry and exit points. The simple calculation method ensures reliability.
Limitations:
- The Awesome Oscillator can produce false signals in ranging or sideways markets when momentum oscillates around zero without clear directional movement, leading to whipsaws. The indicator works best in trending markets.
- The indicator may lag behind price movements during rapid market changes, as it relies on moving averages. This lag can result in delayed entry and exit signals.
- The Awesome Oscillator does not provide information about overbought or oversold conditions on its own, only momentum direction and strength. Traders should combine it with other indicators for more comprehensive analysis.
In summary, the Awesome Oscillator is a valuable momentum indicator that provides clear visual signals for momentum shifts and trend changes, making it ideal for traders using Bill Williams' trading methodology. For comprehensive understanding, refer to Williams' original work "Trading Chaos: Applying Expert Techniques to Maximize Your Profits" (1995), Investopedia's Awesome Oscillator guide, TradingView's Awesome Oscillator documentation, and academic research on momentum oscillators in technical analysis published in journals such as the Journal of Financial Markets and the Review of Financial Studies.
Practical Example: Using the Awesome Oscillator Indicator in a Trading Strategy
The Awesome Oscillator (AO) is a momentum indicator used to identify momentum shifts and potential trend changes through histogram analysis. In a trading strategy, the Awesome Oscillator indicator helps traders make entry and exit decisions based on momentum direction and zero line crossovers.
Scenario: You're creating a momentum-based strategy for Bitcoin (BTC/USDT) on a 1-hour chart. You want to buy when the Awesome Oscillator crosses above zero (indicating upward momentum) and shows a saucer pattern (three consecutive green bars), and sell when it crosses below zero (indicating downward momentum).
Strategy Logic:
- Calculate the Awesome Oscillator using 5-period and 34-period SMAs of median price. The oscillator oscillates around zero, with positive values (green bars) indicating upward momentum and negative values (red bars) indicating downward momentum.
- Buy signal: When the Awesome Oscillator crosses above zero and shows a saucer pattern (three consecutive green bars), indicating strong upward momentum and potential trend continuation.
- Sell signal: When the Awesome Oscillator crosses below zero, indicating downward momentum and potential trend reversal.
Backtrader Example:
import backtrader as bt

class AwesomeOscillatorStrategy(bt.Strategy):
    params = dict(
        fast_period=5,
        slow_period=34
    )

    def __init__(self):
        median_price = (self.data.high + self.data.low) / 2
        self.fast_sma = bt.ind.SMA(median_price, period=self.p.fast_period)
        self.slow_sma = bt.ind.SMA(median_price, period=self.p.slow_period)
        self.ao = self.fast_sma - self.slow_sma

    def next(self):
        if not self.position:
            # Buy when AO crosses above zero and shows saucer pattern
            if (self.ao[0] > 0 and self.ao[-1] <= 0 and
                self.ao[0] > self.ao[-1] and self.ao[-1] > self.ao[-2]):
                self.buy()
        else:
            # Sell when AO crosses below zero
            if (self.ao[0] < 0 and self.ao[-1] >= 0):
                self.sell()

# Usage
cerebro = bt.Cerebro()
cerebro.addstrategy(AwesomeOscillatorStrategy)
Expected Outcome: By using the Awesome Oscillator indicator, your strategy identifies momentum shifts and trend changes through clear histogram signals, helping you enter trades when momentum is building and exit when momentum is weakening. This approach leads to better momentum-based entries, improved signal quality, and enhanced consistency by trading in the direction of momentum.
💡 Bonus Tip
Consider using Awesome Oscillator saucer patterns as confirmation signals. A saucer pattern (three consecutive bars of the same color) indicates momentum acceleration and higher probability of trend continuation. This technique, documented in Bill Williams' original methodology, can significantly improve the accuracy of Awesome Oscillator-based trading strategies.
Using the Awesome Oscillator indicator ensures your strategy captures momentum shifts effectively, improving entry and exit timing based on clear momentum analysis.